| |
 Graham Kraehe, Chairman Graham Kraehe, Chairman PERFORMANCE
I am very pleased to report that 2004/05 has been another outstanding year for BlueScope Steel. Our team's performance over the three years since public listing has been among the best on the Australian Stock Exchange ASX 100 for all industries.
When BlueScope Steel listed three years ago, we committed to operate by the guiding principles of Our Bond and to reward our shareholders. We have met those commitments.
In the past year, revenue has grown by 38% to a record $7.98 billion, demonstrating the strength of the relationships we have built with existing customers, and with new ones.
Net profit after tax was up 72% to $1.007 billion, a reflection of the strength of global steel markets and the performance of BlueScope Steel's people. We are proud to be one of a select group of ASX-listed companies to have achieved a profit of over $1 billion in 2004/05. Earnings per share increased by 77% to $1.37 per share, compared to 78 cents last year.
SHAREHOLDERS
During the year we continued to reward our shareholders. We declared a final dividend of 24 cents per share and a special dividend of 20 cents per share, both fully franked.
For the year, ordinary and special dividends totalled 62 cents per share, compared with 40 cents per share last year. All were fully franked. Return on invested capital increased to 25.4%, up from last year's strong result of 18.5%, and total shareholder return for the year was 30%, paid and declared in respect to 2004/05. In the last three years, $1.58 billion has been invested in share buybacks or dividends, which demonstrates our focus on returns to shareholders.
EMPLOYEES AND COMMUNITIES
BlueScope Steel is committed to providing safe workplaces. The involvement in safety audits by 78% of our 17,500 employees worldwide is evidence of their commitment.
Our Bond emphasises community respect and involvement. In 2004/05 this was underscored by donations of $2.2 million to community causes. This included a major tsunami relief initiative totalling over $1.26 million, with a large proportion donated directly by our employees. BlueScope Steel undertook many other community projects across Asia, New Zealand and the United States, as well as Australia.
It is interesting to reflect on how the $8 billion dollars of revenue we generated in 2004/05 was distributed. $1.3 billion was paid in wages and salaries. $340 million was paid to shareholders as dividends, $330 million was used for share buybacks, $2.1 billion was spent on suppliers, services and utilities, $310 million was paid in income tax, and $660 million was re-invested in our Company's growth projects, with a view to our future prosperity.
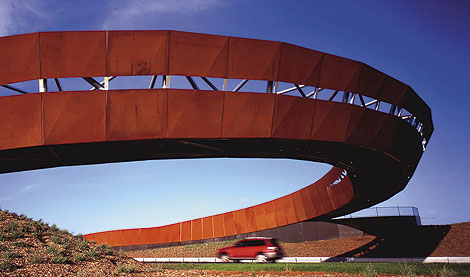 Pedestrian bridge on Hume Freeway, Lalor, Victoria Pedestrian bridge on Hume Freeway, Lalor, Victoria CAPITAL MANAGEMENT
We are proud of BlueScope Steel's capital management record. Since public listing, our total return to shareholders, including ordinary and special dividends, and share buybacks to date is $2.09 per share - representing a 77% pay out ratio. A great advantage of our public listing has been the ability to re-invest in the business for future profitable growth. Over the past three years, we have invested more than $1.5 billion. This includes $724 million in 2004/05, with approximately $700 million anticipated in the 2005/06 financial year. By comparison, in the four years prior to listing, the average amount of capital invested each year was $120 million.
Your Directors believe that BlueScope Steel has continued to meet the short and long term interests of shareholders with an appropriate balance between dividends, share buybacks and long-term growth investments. This is reflected in the fact that, in the period from our public listing on July 15 2002 to June 30 2005, our Total Shareholder Return (growth in share price plus dividends) has been among the highest of any ASX 100 company.
STRATEGY
We are implementing a strategy that will make BlueScope Steel a unique steel company: one that embodies excellence in steelmaking, and also delivers a broad range of innovative, valued steel products and solutions.
So, with three years of outstanding results, and a long-term investment strategy that will help buffer us against steel price volatility, we are well on the way to establishing our credentials. We hope you now regard BlueScope Steel as a core holding in your share portfolio.
GOVERNANCE
BlueScope Steel complies with the ASX principles of Good Corporate Governance and Best Practice Recommendations. I believe the leadership shown by our Board of Directors, the values and standards that have been set, and the strategic guidance the Board has provided are of a high order.
We will continue to reward shareholders. In keeping with the principles of Our Bond, we will also continue to care for our employees, value our relationships with customers, and respect the communities in which we do business. I believe our future success will reflect our Company's adherence to these ideals.
I would like to thank our 17,500 employees for their performance, Managing Director and CEO Kirby Adams and his team for their strong leadership, and my Board colleagues for their contribution. GRAHAM KRAEHE AO, CHAIRMAN
|
| |

Kirby Adams, Managing Director and CEO
This past financial year has been an extraordinary one for BlueScope Steel - a year in which we again rewarded our shareholders as we grew. Indeed, the year has been defined by growth. Revenue was up 38%, while NPAT was up 72% to $1.007 billion.
The current 2005/06 financial year will be an exciting period for your Company - the beginning of the phase in which we deliver on our mid and downstream growth initiatives. We have commenced operations at our second metallic coating facility in Thailand, and a number of major projects will follow, including our metallic coating and painting facility in Vietnam, which is due for start-up early in the 2006 calendar year. Supporting our growth is strong underlying cashflow, and a robust balance sheet.
IN 2006, WE WILL SEE THE FIRST BENEFITS OF A
RE-BALANCED PORTFOLIO, AS WE ARE NOW MIDWAY THROUGH OUR $2 BILLION GROWTH PROGRAM, INVOLVING OVER 20 PROJECTS IN EIGHT COUNTRIES.
SAFETY
We also care for 17,500 employees and contractors in 84 manufacturing sites across 17 countries. BlueScope Steel continues to run a major safety program and we continue our drive for Zero Harm. Key indicators are very encouraging. Our lost time injury frequency rate (LTIFR) was a record low of less than one lost time injury per million hours worked during the year. Our medical treatment injury frequency rate (MTIFR) was 9.2 medically treated injuries per million hours worked including our Butler operations, and 4.4 excluding Butler. Our Asian businesses were most impressive in this area, achieving 16 million working hours without any lost time through injury.
However, our safety achievements were marred by a tragic death. In the days following this fiscal year, an employee at our New Zealand Steel business was fatally injured at work. I have sent our deepest condolences to his family, friends and colleagues, and our recent Stop for Safety again emphasised the importance of safety and equipment isolation. Our goal of Zero Harm is the responsibility of us all. Every day, everywhere, without exception.
OUTSTANDING FINANCIAL PERFORMANCE
On behalf of our 17,500 employees, we have an outstanding set of results to report to our owners. Our total revenue was a record $7.98 billion, up $2.2 billion, or 38%, on the previous year. Of this amount, $1.2 billion was contributed by our recently acquired Butler businesses. Demand for our excellent BlueScope Steel products has been strong in all markets.
Despatches were up 5% on the previous year, and EBIT was up $570 million, to a record $1.388 billion. NPAT was a record $1.007 billion, while earnings per share was $1.37, enhanced by our share buyback programs. Return on invested capital was a robust 25.4%, with return on equity 30%, after tax. Net operating cashflows were up 37% to $1.2 billion. We used this cash in a balanced way, committing $660 million dollars to capital expenditure and investments, with $670 million returned to our shareholders.
One of our objectives has been to align the interests of our employees with the interests of you, our owners. Share ownership among employees is now approaching 100%. We believe a genuine sense of ownership among our employees is contributing to our Company's strong performance.
OUR GROWTH STRATEGY
Our renewal strategy continues, with significant growth initiatives ahead and underway. Many are now familiar with our program of faster growth for our mid and downstream businesses. Our aim is to re-balance our portfolio of businesses, thereby reducing cyclical risk. We are on schedule in our efforts to change the profile of your Company.
In the current year, we will see the first benefits of a re-balanced portfolio, as we deliver on this strategy. We are now midway through our $2 billion growth program, which involves over 20 major projects in eight countries.
We have commissioned our new $80 million metallic coating facility in Thailand. Our $160 million metallic coating and painting facility in Vietnam will start up early in the 2006 calendar year, with our $280 million China metallic coating and painting facility commencing operations in the middle of the 2006 calendar year.
During the year, we announced a $100 million investment program for India - a country that is entering a period of vigorous economic growth. Our downstream earnings will be boosted by a number of new facilities around the world, including our Western Sydney COLORBOND® facility, new rollforming and pre-engineered building (PEB) facilities in China, our new Butler Manufacturing plant in Jackson, Tennessee, and the Western Australia Service Centre. We are also expanding our Vistawall extrusion plant in Tennessee.
THE NEXT FEW YEARS WILL BE EXCITING ONES, AS WE DELIVER ON OUR MIDSTREAM AND DOWNSTREAM GROWTH INITIATIVES AND FURTHER IMPROVE OUR STEELMAKING ASSETS.
The resultant portfolio will comprise a unique multi-national franchise, with greater balance and diversification in terms of geography, products and markets. BlueScope Steel is uniquely positioned as the only pan-Asian provider of steel building solutions.
A crucial part of this strategy is business excellence. Consequently, we continue our drive for excellence in areas such as cost reduction and capital efficient capacity increases. We continuously work on improving our offers to customers, improving technical support, delivery reliability and lead times, and managing volatility. New products are another focus in our drive for excellence, with great energy directed into research and development, product development and extensions, along with new global alliances and acquisitions.
ACHIEVING OUR BUSINESS GOALS
Last year, we achieved many of our demanding goals with strong performance across our geographic footprint. We have now attained market leadership in a number of segments around the world, including PEBs in North America and China, downstream steel solutions in Asia and Australia, and an unmatched network of metallic coating, painting and rollforming facilities.
Our Asian businesses achieved stable profit performance, despite being faced with higher costs. This segment's performance was affected by an increase of $19 million in pre-operating costs related to projects underway in China, India, Thailand and Vietnam. Higher feedstock costs were offset by increased prices, and the segment exceeded $1 billion in revenue for the first time. Our employees in Asia are continually pushing for growth in this energised region, which we consider a core growth corridor.
In North America, we are working hard to build and transform our downstream businesses. Revenue for this business unit exceeded $1 billion, with the first half year showing a reasonable turnaround, while the second half was disappointing. However, even as this transformation is completed, the benefits of Butler and Vistawall capabilities are being felt across the company, particularly in Asia, where PEB markets are growing.

From left: Executive Leadership Team members Ian Cummin and Brian Kruger with
Kirby Adams.
The stand out performance during the past year was from our three upstream steelmaking businesses. These operations responded with vigour to the high product margins experienced in the steelmaking industry, and generated revenue of almost $4 billion. Super-profitability was achieved by Port Kembla Steelworks, New Zealand Steel and the 50% owned North Star BlueScope Steel in Ohio, USA. Total EBIT for this group was a record $1.521 billion, up 143% on last year. Production and safety records were set by all these businesses, while our North Star BlueScope Steel joint venture also cleared its debts and paid its first dividend to BlueScope Steel. Customers once again voted this business 'the number one flat rolled steel supplier in North America', in the prestigious Jacobson survey. I congratulate all those involved in our very successful steelmaking operations in Australia, New Zealand and North America.
Our downstream coated, painted, packaging, building products and steel solutions businesses in Australia dealt with a number of challenges during the year, including much higher input costs, strike actions and restructures. The second half saw a recovery, due to price increases, while our decision to exit the export packaging products business resulted in $25 million of restructuring costs. Demand for our colourful products remains strong, particularly in non-residential markets in Australia.
OUTLOOK
The 2004/05 financial year has been an exceptional one - the best in our Company's 87 year history. In the coming year, we expect strong demand for our products to continue. However, BlueScope Steel will again be affected by external cost pressures such as raw materials and freight. As a result of the mismatch between raw material prices and steel prices, we are absorbing an increase of approximately $600 million, or 90%, in raw material costs, and this cannot be entirely recovered this year. But by achieving increases in prices and production volumes, commissioning many new projects, and improving the performance of our acquisitions, we are working to make 2005/06 at least our second-best year ever.
Recent forecasts of GDP growth rates for the 2006 financial year indicate continuing good levels of growth in Australia, New Zealand, the USA, China and South East Asia. China's GDP is expected to grow at greater than 5%, with global GDP growth exceeding 3%. These forecasts confirm the economic premise on which our growth strategy is based, and suggest our regional economy will continue to be the fastest growing steel products market in the world.
In October 2004, I addressed the Board of the International Iron and Steel Institute on ways in which our global steel industry could improve itself. As Institute Chairman, I called for greater industry consolidation, and for a more responsible approach to capacity expansion. It is heartening to see evidence of these trends at play in the global steel industry. For example, China, which now has steel companies that are members of the IISI, has announced measures in both these areas. As a supplier to China's building and construction markets, we welcome moves that contribute to more stable growth.
BlueScope Steel achieved more last year than most would have anticipated. So I thank our shareholders for investing in BlueScope Steel, our customers for their continuing confidence and business, and our communities for hosting our operations and continuing to use our beautiful and colourful steel products and solutions.
Finally, I would like to acknowledge the efforts of our employees. BlueScope Steel's achievements reflect the high calibre of our people. With few exceptions, they are talented, dedicated, and innovative. They are team players and people of integrity. And importantly, they care for their colleagues, our customers, their communities, and our shareholders. I thank them all for these extraordinary results.
Kirby Adams,
Managing Director and CEO
|
| |
The directors of BlueScope Steel Limited ("BlueScope Steel") present their report on the consolidated entity ("BlueScope Steel Group") consisting of BlueScope Steel Limited and its controlled entities for the financial year ended 30 June 2005.
PRINCIPAL ACTIVITIES
During the year the principal continuing activities of the BlueScope Steel Group, based principally in Australia, New Zealand, North America, China and elsewhere in Asia, were:
(a) Manufacture and distribution of flat steel products;
(b) Manufacture and distribution of metallic coated and painted steel products;
(c) Manufacture and distribution of steel building products; and
(d) Design and manufacture of pre-engineered steel buildings and building solutions.
SIGNIFICANT CHANGES IN STATE OF AFFAIRS
The following significant events occurred during the year:
a) The Company is progressing a range of growth initiatives aimed at expanding the manufacture and distribution of metallic coating and painted steel products. The following projects were approved:
Approved in 2003/2004
· Thailand: installing a second metallic coating line (capacity: 200,000 tonnes per annum) at the Map Ta Phut plant. The facility will cost approximately $80 million and is scheduled for completion in August 2005;
· Vietnam: the construction of a new metallic coating (capacity: 125,000 tonnes per annum) and painting (capacity: 50,000 tonnes per annum) facility. The facility will cost approximately $160 million and is expected to commence operation in early calendar year 2006; and
· China: a new metallic coating (capacity: 250,000 tonnes per annum) and painting (capacity: 150,000 tonnes per annum) facility. The facility will cost approximately $280 million and is expected to commence operation in mid calendar year 2006.
Approved in 2004/2005
· China: the Group's first Butler PEB/Lysaght facility. The facility will cost approximately $45 million and is expected to commence operation mid calendar year 2006;
· India: three new facilities delivering a range of Lysaght and Butler products. The facilities will cost approximately $100 million and will progressively commence operations during 2006 and 2007;
· Australia: a new painting facility (capacity: 120,000 tonnes per annum) in western Sydney. The facility will cost approximately $120 million and is expected to commence operation in early calendar year 2007; and
· Australia: an expansion of the Hot Strip Mill (capacity increase: 2.4 to 2.8 million tonnes per annum) at the Port Kembla Steelworks. The expansion will cost approximately $100 million and is expected to commence operation in the second half of calendar year 2006.
b) The Company expanded its Australian manufacturing, sales and distribution capabilities through a number of acquisitions in the BlueScope Lysaght and BlueScope Water businesses.
c) In March 2005, the Company decided to withdraw from its unprofitable export tinplate business, commencing from April 2005, resulting in the planned closure of some operating lines within two years.
d) On 1 July 2004, the Company completed a debut debt raising in the US private placement market totalling US$300 million with terms of 7 years (US$100 million) and 10 years (US$200 million).
MATTERS SUBSEQUENT TO THE END OF THE FINANCIAL YEAR
No matters or circumstances have arisen since 30 June 2005 that have significantly affected, or may significantly affect, the BlueScope Steel Group operations, results or state of affairs in future.
DIVIDENDS
BlueScope Steel paid a fully franked dividend for the year ended 30 June 2004 of 18 cents per share and a special dividend of 10 cents per share in October 2004, and a fully franked interim dividend of 18 cents per share in April 2005 to its shareholders.
On 23 August 2005, it was announced that Directors determined to pay a final fully franked dividend of 24 cents per share, which is to be paid on 24 October 2005 (record date 5 October 2005) to shareholders. The Directors have also announced a fully franked special dividend of 20 cents payable on 24 October 2005.
REVIEW AND RESULTS OF OPERATIONS
The BlueScope Steel Group comprises five business reporting segments: Hot Rolled Products, New Zealand and Pacific Steel Products, Coated and Building Products Australia, Coated and Building Products Asia, and Coated and Building Products North America. A description of the operations comprising these segments is provided in to the Annual Financial Report.
| |
SEGMENT REVENUES |
SEGMENT REVENUES |
SEGMENT RESULTS |
SEGMENT RESULTS |
| |
2005 |
2004 |
2005 |
2004 |
|
$M
|
$M
|
$M
|
$M
|
| Sales Revenue |
|
|
|
|
| Hot Rolled Products |
3,939.5 |
2,838.6 |
1,338.5 |
563.8 |
| New Zealand Steel and Pacific Steel Products |
756.4 |
590.2 |
182.8 |
62.1 |
| Coated and Building Products Australia |
3,190.3 |
2,883.5 |
(115.7) |
192.9 |
| Coated and Building Products Asia |
1,051.3 |
698.6 |
81.8 |
104.0 |
| Coated and Building Products North America |
1,134.4 |
191.5 |
(19.7) |
(8.8) |
| Corporate and Group |
359.9 |
372.9 |
(70.2) |
(64.0) |
| Intersegment eliminations |
(2,494.1) |
(1,837.9) |
(9.1) |
(32.1) |
| Other Revenue |
43.9 |
32.2 |
|
|
|
|
|
|
|
| Operating Revenue/EBIT |
7,981.6 |
5,769.6 |
1,388.4 |
817.9 |
| Net unallocated expenses |
|
|
(34.3) |
(14.5) |
|
|
|
|
|
| Profit from ordinary activities before income tax |
|
|
1,354.1 |
803.4 |
| Income tax expense |
|
|
(347.0) |
(201.6) |
|
|
|
|
|
| Profit from ordinary activities after income tax expense |
|
|
1,007.1 |
601.8 |
| Net profit attributable to outside equity interest |
|
|
(0.1) |
(17.7) |
|
|
|
|
|
| Net profit attributable to members of BlueScope Steel |
|
|
1,007.0 |
584.1 |
|
|
|
|
|
| Earnings per share (cents) |
|
|
137.4 |
77.8 |
Building on the strong performance of previous years, the BlueScope Steel Group has achieved a record financial result, delivering a net profit of $1,007.0 million and earnings per share of 137.4 cents.
The Company's revenue increased $2,212.0 million to $7,981.6 million, primarily achieved through acquisitions, improved prices, and a favourable shift in the mix of despatches from export to domestic. These were partly offset by a reduction in the value of USD-denominated sales, due to the strengthening of the Australian dollar.
Net profit after tax increased $422.9 million to a record $1,007.0 million. This improvement was due primarily to higher international and domestic steel prices, improved margins from North Star BlueScope Steel, and a favourable shift in mix of despatches from export to domestic. These were partly offset by higher raw material and operating costs, higher planned repairs and maintenance to improve operating stability, higher business development costs, and the net impact of a higher AUD/USD exchange rate on USD-denominated revenues and costs.
Hot Rolled Products
The earnings contribution from the Hot Rolled Products segment increased as a result of stronger hot rolled coil and slab pricing (to export, domestic and intersegment customers), and a substantial increase in margins from North Star BlueScope Steel. These were partly offset by higher scrap, coking coal, iron ore, alloys and freight costs, together with an increase in repairs and maintenance expenditure to ensure reliability of operations, which underpins increased production capacity together with the optimisation of asset lives.
New Zealand and Pacific Steel Products
The earnings contribution from the New Zealand and Pacific Steel Products segment increased as a result of domestic and export price increases, and higher prices for vanadium slag (a steel making by-product) and continuing strong New Zealand domestic sales volumes.
Coated and Building Products Australia
The earnings contribution from the Coated and Building Products Australia segment was significantly affected by higher hot rolled coil and slab feed costs (from Hot Rolled Products), which compressed margins despite price increases in both domestic and export markets. Earnings were also affected by industrial action at the Western Port facility, an increase in repairs and maintenance and restructuring costs associated with the withdrawal from export tinplate. These were partly offset by a favourable shift in mix of despatches from export to domestic.
Coated and Building Products Asia
The earnings contribution from the Coated and Building Products Asia segment was lower primarily due to an increase in business development and pre-production costs associated with developments in Vietnam, Thailand, India and China, together with operating cost increases. These were partly offset by sales volume increases as a result of market growth initiatives and the integration of BlueScope Butler China. The segment maintained gross margins despite significant increases in steel feed and coating metal costs.
Coated and Building Products North America
Butler Manufacturing Company, a leading manufacturer of pre-engineered buildings, was acquired in April 2004 bringing a new suite of building and construction products to the Company. This new segment delivered negative earnings for the year. However, when compared with comparative period earnings normalised for discontinued operations and acquisition related costs, earnings improved $8 million. This improvement was achieved primarily through higher margins but was negatively affected by costs associated with the early closure of the Galesburg, Illinois plant and start-up costs of a replacement plant at Jackson, Tennessee.
LIKELY DEVELOPMENTS AND EXPECTED RESULTS
Demand for BlueScope Steel's products is expected to remain firm during the 2005/06 financial year.
Spot prices for commodity steel products in global markets have fallen in recent months and currently appear to have stabilised or increased in certain regions. Increases in iron ore and coal prices will raise BlueScope Steel's costs by approximately $380 million (pre-tax) compared to the 2004/05 financial year. The Company is unlikely to be able to fully recover these cost imposts and therefore upstream margins in the Hot Rolled Product segment will likely be lower. However, we expect margins in our midstream coating/painting and downstream roll forming and pre engineering building businesses will improve.
During the 2005/06 financial year, the Company will continue to work on improving those factors within its control.
BOARD COMPOSITION
The following were Directors for the full financial year: Graham John Kraehe AO (Chairman), Ronald John McNeilly (Deputy Chairman), Kirby Clarke Adams (Managing Director and Chief Executive Officer), Diane Jennifer Grady, Harry Kevin (Kevin) McCann AM, Paul John Rizzo and Tan Yam Pin. John Crabb resigned effective 28 July 2004.
Particulars of the skills, experience, expertise and special responsibilities of the Directors are set out under Information on and form part of this report.
COMPANY SECRETARIES
Michael Barron Chief Legal Officer and Company Secretary, BEc, LLB, ACIS
Michael Barron is responsible for the legal affairs of BlueScope Steel and for Company secretarial matters. Prior to joining BlueScope Steel, Mr Barron held the position of group general counsel of Orica Limited where he was employed for 16 years, holding a variety of legal positions in Australia and overseas.
Lisa Nicholson, B.Sc., LLB, ACIS
Lisa Nicholson is responsible for Company secretarial matters for BlueScope Steel and its subsidiaries. Ms Nicholson has company secretarial and legal experience gained from working with Coles Myer Ltd, Lend Lease Employer Systems Ltd and DaimlerChrysler Australia/Pacific Pty Ltd.
Laurence Mandie, B.Sc. (Hons), LLB (Hons)
Laurence Mandie is a corporate counsel with BlueScope Steel and is responsible for the legal affairs of the Australian Building and Logistics Solutions businesses, and corporate functions such as finance and IT. Mr Mandie has extensive legal experience gained from working in the Mergers and Acquisitions group of Freehills, a national law firm and on secondment, as Acting General Counsel and Company Secretary of Pasminco Limited.
PARTICULARS OF DIRECTORS' INTERESTS IN SHARES AND OPTIONS OF BLUESCOPE STEEL LIMITED
Director |
Ordinary shares |
Share rights |
G J Kraehe |
109,676 |
0 |
| K C Adams* |
1,825,881 |
945,000 |
| D J Grady |
36,358 |
0 |
| H K McCann |
21,913 |
0 |
| R J McNeilly |
514,587 |
0 |
| P Rizzo |
24,702 |
0 |
| Y P Tan |
11,980 |
0 |
* Mr Adams' current holding of BlueScope Steel Limited shares includes 685,000 arising from BlueScope Steel long term incentive plan. The remaining shares have been acquired with his own funds.
MEETINGS OF DIRECTORS
The attendance of the current Directors at Board and Board Committee meetings from 1 July 2004 to 30 June 2005 is as follows:
| |
BOARD MEETINGS |
|
|
COMMITTEE MEETINGS |
|
|
| |
|
|
Audit and Risk |
Remuneration and
Organisation
Committee |
Health, Safety
& Environment |
Nomination |
| |
|
|
|
|
|
|
|
|
|
|
|
|
|
|
|
|
|
|
|
|
|
| |
A |
B |
A |
B |
A |
B |
A |
B |
A |
B |
| G J Kraehe |
13 |
13 |
- |
*5 |
5 |
5 |
4 |
4 |
5 |
5 |
| K C Adams |
13 |
13 |
- |
*4 |
- |
*3 |
4 |
4 |
- |
*5 |
| D J Grady |
13 |
13 |
- |
- |
5 |
5 |
4 |
4 |
5 |
5 |
| H K McCann |
13 |
13 |
5 |
5 |
- |
- |
4 |
4 |
5 |
5 |
| R J McNeilly |
13 |
13 |
5 |
5 |
5 |
5 |
4 |
4 |
5 |
5 |
| P Rizzo |
13 |
13 |
5 |
5 |
- |
- |
4 |
4 |
5 |
5 |
| Y P Yan |
13 |
12 |
- |
- |
5 |
5 |
4 |
4 |
5 |
5 |
|
|
|
|
|
|
|
|
|
|
|
All Directors have held office for the entire 2004/05 financial year. Mr Crabb resigned as a Director of BlueScope Steel on 28 July 2004 and attended no meetings during the 2004/05 financial year.
A = number of meetings held during the period 1 July 2004 to 30 June 2005 during the time the Director was a member of the Board or the Committee as the case may be.
B = number of meetings attended by the Director from 1 July 2004 to 30 June 2005 while the Director was a member of the Board or the Committee as the case may be.
* = not a member of the relevant Committee. However, Directors who are not members of the relevant Committee often attend meetings.
There were a number of unscheduled meetings held during the year. They are as follows:
Board meetings: 2
Roc meetings: 1
The Non-Executive Directors met twice during the 2004/05 financial year without the presence of management.
REMUNERATION REPORT
ENVIRONMENTAL REGULATION
BlueScope Steel's Health, Safety, Environment and Community ("HSEC") Policy provides the foundation for the way in which environment is managed at all levels of the organisation. BlueScope Steel cares for the environment and is committed to the efficient use of resources, reducing and preventing pollution and product stewardship. Product stewardship is a product-centred approach to environmental protection, focusing on all aspects of the product lifecycle.
The BlueScope Steel Group has continued to ensure its environmental management systems are robust by again achieving ISO 14001 accreditation following a series of external reviews performed during the reporting period. BlueScope Steel has also developed a customised compliance system to enable its environmental responsibilities to be appropriately managed. This provides a systematic means for line management to both understand and demonstrate compliance with their specific statutory obligations on a monthly basis. The environmental compliance system has been successfully implemented at a number of BlueScope Steel's operations, including Port Kembla, Springhill and Western Port already. It is anticipated that by the end of the 2005-2006 financial year, the compliance system will have been implemented at most of BlueScope Steel's operations.
BlueScope Steel notified relevant authorities of a number of statutory non-compliances with environmental regulations during the reporting period. Most of these were relatively minor in nature and related to the Port Kembla Steelworks in New South Wales (NSW) Australia. There were no significant environmental incidents recorded during the reporting period.
As reported in last year's Directors' Report, BlueScope Steel received a fine of $70,000 under the Protection of Environment Operations Act (NSW) 1997, in July 2004, over an incident at the Port Kembla Steelworks in March 2003 that caused air emissions resulting from a failure to maintain equipment. This is reported as the fine was handed down within the 2004-2005 financial year.
The Port Kembla Steelworks has entered into voluntary agreements with the NSW Department of Environment and Conservation ("DEC") to investigate possible land contamination of two areas within its site, the No.2 Steelworks and the recycling area. These investigations continue to take place in consultation and co-operation with the DEC.
INDEMNIFICATION AND INSURANCE OF OFFICERS
BlueScope Steel has entered into directors' and officers' insurance policies and paid an insurance premium in respect of the insurance policies, to the extent permitted by the Corporations Act 2001. The insurance policies cover former Directors of BlueScope Steel along with the current of BlueScope Steel. Executive officers and employees of BlueScope Steel and its related bodies corporate are also covered.
In accordance with Rule 21 of its Constitution, BlueScope Steel, to the maximum extent permitted by law:
· must indemnify any current or former Director or Secretary; and
· may indemnify current or former executive officers, of BlueScope Steel or any of its subsidiaries, against all liabilities (and certain legal costs) incurred in those capacities to a person, including a liability incurred as a result of appointment or nomination by BlueScope Steel or its subsidiaries as a trustee or as a director, officer or employee of another corporation.
The current Directors of BlueScope Steel have each entered into an Access, Insurance and Indemnity Deed with BlueScope Steel. The Deed addresses the matters set out in Rule 21 of the Constitution and includes, among other things, provisions requiring BlueScope Steel to indemnify a Director to the extent to which they are not already indemnified as permitted under law, and to use its best endeavours to maintain an insurance policy covering a Director while they are in office and seven years after ceasing to be a Director.
The Directors have not included details of the nature of the liabilities covered or the amount of the premium paid in respect of the directors' and officers' liability insurance contract, as (in accordance with normal commercial practice) such disclosure is prohibited under the terms of the contract.
Under the terms of the agreement for the acquisition of Butler Manufacturing Company, the Company undertook to assume Butler Manufacturing's commitments to indemnify, and maintain insurance in respect of, former Directors and officers of Butler Manufacturing against liabilities incurred by them as directors and officers, to the extent permitted by Delaware law. On acquisition of Butler Manufacturing Company, BlueScope Steel continued Butler's arrangements to indemnify former Directors and officers.
PROCEEDINGS ON BEHALF OF BLUESCOPE STEEL
As at the date of this report, there are no leave applications or proceedings brought on behalf of BlueScope Steel under section 237 of the Corporations Act 2001.
ROUNDING OF AMOUNTS
BlueScope Steel is a company of a kind referred to in Class Order 98/0100, issued by the Australian Securities and Investments Commission, relating to the "rounding off" of amounts in the Directors' Report. Amounts in the Directors' Report have been rounded off in accordance with that Class Order to the nearest hundred thousand dollars.
AUDITOR
Ernst & Young was appointed as auditor for BlueScope Steel at the 2002 Annual General Meeting.
AUDITOR INDEPENDENCE AND NON-AUDIT SERVICES
The auditor's independence declaration for the year ended 30 June 2005 has been received from Ernst & Young. This is set out .
· Ernst & Young provided the following non-audit services during the year ended 30 June 2005. $497,000; international assignee employment taxation services;
· $178,000; country specific taxation compliance services and advice in New Zealand, Malaysia, Vietnam and North America;
· $139,000; specific compliance tax services in relation to the acquisition of Butler Manufacturing Company;
· $5,000; review of BlueScope Steel (Thailand) Board of Investment Report; and
· $26,000; bookkeeping and tax services for Butler Manufacturing Company's Chile subsidiary. The Directors were satisfied, on the basis of materiality, that auditor independence was not compromised. Note: Butler Manufacturing Company was previously audited by KPMG.
The Directors are satisfied that the provision of these non-audit services is compatible with the general standard of independence for auditors in accordance with the Corporations Act. The nature and scope of each type of non-audit service provided is considered by the Directors not to have compromised auditor independence. The Directors' belief is consistent with advice received by the Audit and Risk Committee of the Board.
This report is made in accordance with a resolution of the directors.
G J KRAEHE
CHAIRMAN
K C ADAMS
MANAGING DIRECTOR AND CEO
Melbourne
22 August 2005
Auditor's Independence Declaration to the Directors of BlueScope Steel Limited
In relation to our audit of the financial report of BlueScope Steel Limited for the year ended 30 June 2005, to the best of my knowledge and belief, there have been no contraventions of the auditor independence requirements of the Corporations Act 2001 or any applicable code of professional conduct.
ERNST & YOUNG
A I BECKETT
PARTNER
Melbourne
22 August 2005
|
| |
1. POLICY AND STRUCTURE
1.1 Board Policy Setting
The Board oversees the BlueScope Steel Human Resources Strategy, both directly and through the Remuneration and Organisation Committee of the Board. The purpose of the Committee as set out in its charter is "...to assist the Board to ensure that the Company:
� has a human resources strategy aligned to the overall business strategy, which supports "Our Bond";
� has coherent remuneration policies that are observed and that enable it to attract and retain executives and Directors who will create value for shareholders;
� fairly and responsibly rewards executives having regard to the performance of the Company, the creation of value for shareholders, the performance of the executive and the external remuneration environment; and
� plans and implements the development and succession of executive management."
As part of its charter the Committee considers remuneration strategy, policies and practices applicable to Non-Executive Directors, the Managing Director and Chief Executive Officer, senior managers and employees generally.
Input to the Committee's operations is sought from the Managing Director and Chief Executive Officer and the Executive Vice President People and Performance who both attend Committee meetings, as appropriate. In addition, advice is received from independent expert advisers in a number of areas including:
� Remuneration benchmarking
� Short term incentives
� Long term incentives
� Contract terms
The Board recognises that BlueScope Steel operates in a highly competitive global environment and that the performance of the Company depends on the quality of its people.
The Company's approach to remuneration for Non-Executive Directors and employees, with particular reference to salaried employees and senior managers is set out below.
1.2 Non-Executive Directors' Remuneration
Fees and payments to Non-Executive Directors reflect the demands which are made on, and the responsibilities of, the Directors. Non-Executive Directors' fees and payments are reviewed annually. The Board has sought the advice of an expert external remuneration consultant to ensure that fees and payments to Non-Executive Directors, the Chairman of the Board and the Chairman of Committees of the Board reflect their duties and are in line with the market. The Chairman is not present at any discussions relating to the determination of his own remuneration.
Non-Executive Directors do not receive share rights or other performance based rewards. Non-Executive Directors are expected to accumulate over time a shareholding in the Company at least equivalent in value to their annual remuneration. Non-Executive Directors are required to salary sacrifice a minimum of 10% of their remuneration each year and be provided with BlueScope Steel shares (instead of cash fees), which are acquired on-market in the approved policy windows. Shareholders approved this arrangement at the Annual General Meeting in November 2003, and Non-Executive Directors commenced participation in this arrangement in January 2004.
The current annual base fees for Non-Executive Directors are as follows:
� Chairman - $420,000
� Deputy Chairman - $220,000
� Directors - $140,000
The remuneration of the Chairman and Deputy Chairman is inclusive of Board Committee fees. Other Non-Executive Directors who chair a Board Committee receive additional yearly fees and members of the Audit and Risk Committee also receive an additional yearly fee on the basis of advice from the remuneration consultant. The current annual Committee Chair fees are as follows:
� Remuneration and Organisation Committee - $20,000
� Audit and Risk Committee - $30,000
� Health, Safety, Environment and Community Committee - $15,000 (Currently chaired by the Deputy Chairman of the Board so no fee is currently paid).
Members of the Audit and Risk Committee (other than Chairman and Deputy Chairman of Board and the Chairman of the Committee) receive a fee of $15,000 per annum.
Mr Tan (a resident of Singapore) receives a travel and representation allowance recognising his involvement in representing the Board in activities with BlueScope Steel's Asian business and the significant travel requirement imposed in respect of his attendance at meetings. This allowance is currently $20,000 per annum.
Non-Executive Directors' fees are determined within an aggregate Directors' fee pool limit, which is approved by shareholders. The maximum fee pool limit is $1,750,000 per annum (inclusive of superannuation) as approved by shareholders at the Annual General Meeting in 2003. As it has been 3 years since the fee limit was established, the Board believes it appropriate to seek shareholder approval at the forthcoming Annual General Meeting, to raise the maximum remuneration payable to $2,250,000 per annum (inclusive of superannuation). Approval will allow BlueScope Steel the flexibility to appoint another Director without exceeding the limit.
Compulsory superannuation contributions on behalf of each Director are paid in addition to the fees capped at $11,585. Non-Executive Directors do not receive any other retirement benefits.
Non-Executive Director Fees and payments will be next reviewed by an independent expert in January 2006.
1.3 Salaried Employees
1.3.1. Principles
BlueScope Steel has approximately 7,600 salaried employees. Other employees are covered by Collective Agreements or statutory instruments in the countries in which BlueScope Steel operates.
BlueScope Steel's remuneration and reward practices aim to attract, motivate and retain talent of the highest calibre and support "Our Bond" by creating distinguishable differences in remuneration, consistent with performance.
The Company's salaried remuneration framework is designed to:
� make a clear link between rewarding employees and the creation of value for the shareholders and the business.
� Recognise and reward individual performance and accountability for key job goals.
� Provide distinguishable remuneration differences between levels.
� Maintain a competitive remuneration level relative to the markets in which the Company operates.
The framework is built on an appropriate mix of base salary/pay (including work and expense related allowances), variable pay/short term incentives and long term equity participation opportunities.
1.3.2 Base Salary/Pay
Base salary/pay is determined by reference to the scope and nature of an individual's role, performance, experience, work requirements and market data.
Market data is obtained from external sources to establish appropriate guidelines for positions, with the goal to pay slightly above median.
1.3.3 Variable Pay and Short Term Incentives
Most employees have access to a variable/at risk component of remuneration in the form of a performance related pay, or other variable pay schemes in which reward is at risk. All senior managers and many salaried employees participate in a formal short term incentive plan.
The Short Term Incentive Plan (STI) is an annual "at risk" cash bonus scheme which is structured to deliver total compensation in the upper quartile for the respective market group when stretch performance is attained. STI awards are not an entitlement but rather the reward for overall company results and the individual or team contribution to performance. The scheme is applied at the discretion of the Board which has established rules and protocols to ensure that STI payments are aligned with organisation and individual performance outcomes. Target Short Term Incentive levels are set having regard to appropriate levels in the market and range from 10% of base salary through to 100% at CEO level. For outstanding results, participants may receive up to 150% of their target bonus amount.
Goals are established for each participant under the following categories which are drawn from the "Our Bond" charter. Each year objectives are selected to focus on key areas which underpin the achievement of outstanding performance including:
� Shareholder Value Delivery - financial performance measures are used including Net Profit After Tax, Cash Flow, and Earnings Before Interest and Tax. Company wide financial performance goals are predetermined by the Board with the goals for the combined individual businesses required to exceed the overall goal. A minimum of 30% of STI Plans at senior manager level (with 60% at CEO level), is based on BlueScope Steel wide financials. For other participants, 20% of the Plan is based on BlueScope Steel corporate financials.
� Zero Harm - safety and environmental performance measures, including Lost Time Injury Frequency Rates, Medical Treatment Injury Frequency Rates and environmental measures.
� Business Excellence - performance measures for the financial year ended 30 June 2005 were focused on delivery performance, days of inventory and quality measures.
� Strategy - implementation of specific longer term strategic initiatives.
STI Plans are developed using a balanced approach to Financial/Shareholder value and Key Performance Indicator (KPI) metrics. At the senior executive level, 60% of the STI award is based on Financial/Shareholder value measures with 40% based on KPI metrics. For other participants, 50% of the STI award is based on Financial/Shareholder value measures and 50% is based on KPI metrics.
Predetermined performance conditions including threshold, target and stretch hurdles are set for each plan and are assessed against these conditions using quantified and verifiable measures or an assessment of value contribution. Target levels are set having regard to the desired result for each goal. The applicable threshold and stretch ranges are set taking into account the degree of stretch inherent in the target. The threshold is the minimum performance level for which a payment will be made. The stretch is the maximum level. Consequently, if threshold is not reached, no payment is made in respect of that goal.
1.3.4 Equity Based Opportunities
The Board gives consideration each year to the creation of opportunities for employees to participate as equity owners in the Company based on Company performance and other relevant factors. Shareholder approval is sought for any shares or share rights to be granted to the Managing Director and Chief Executive Officer.
a) Employee Share Plans
In August 2004, all employees were invited to participate in a scheme which provided for a grant of 150 ordinary BlueScope Steel shares (or a reward of equal value in countries where the issue of shares was not practicable). The aim of the Plan was to assist employees to build a stake in the Company by providing each eligible employee with a parcel of shares, at no cost to the employee. Employees who become shareholders have the potential to benefit from dividends paid on the shares, growth in the market value of their shares and any bonus shares or rights issues the Board of Directors may approve from time to time.
The form of the share offer depended on local regulations and tax laws. In Australia, eligible employees were offered shares with a restriction on trading of these shares for 3 years. Over 99% of employees worldwide who were offered shares participated in the Plan.
The allocation of shares to employees under such schemes and the form of the offer is at the discretion of the Board and is considered on a year by year basis.
b) Long Term Incentive Plan - Approach
Consideration is also given on an annual basis to the award of share rights to senior managers under the Long Term Incentive Plan. The Long Term Incentive Plan is designed to reward senior managers for long term value creation. It is part of the Company's overall recognition and retention strategy having regard to the long term incentives awarded to senior managers in the markets in which the Company operates.
The decision to make an award of share rights is made annually by the Board. Individual participation is determined based on the:
� Strategic significance of the role and outcomes achieved.
� Impact on strategic outcomes in terms of special achievements or requirements.
� Future potential and succession planning requirements.
� Performance and personal effectiveness in achieving outstanding results.
Details of the awards under the Plan since the demerger are set out below. In summary, the main features of the Plan is as follows:
� The awards are generally made in the form of share rights (with the exception of part of the July 2002 award as set out below). Share rights are a right to acquire an ordinary share in BlueScope Steel at a later date subject to the satisfaction of certain performance criteria.
� The vesting of share rights under the Plan requires a sustained performance over a number of years (usually 3) with a hurdle based on Total Shareholder Return (TSR) relative to the TSR of the companies in the S&P/ASX 100 index at the award grant date. The hurdles have been set to underpin the creation of superior Total Shareholder Return in the context of the top 100 Australian Companies.
� The share rights available for exercise are contingent on BlueScope Steel's ranking - TSR percentile with either a stepped vesting (2002 awards) or a sliding scale (2003 and 2004 awards) with the minimum ranking for vesting being the 51st percentile. With sliding scale vesting the total number of share rights that vest for a senior manager increase proportionally as BlueScope Steel's TSR percentile ranking increases. The sliding scale introduced in 2003 was based on advice from an external remuneration consultant and was part of a review which balanced short and long term risk in the short and long term incentive schemes.
� Given the potential volatility of the Company's earnings and the cyclical nature of the markets in which the Company operates, provision is generally made for limited retesting on a predetermined basis (however, this does not apply to the September 2002 award).
� Any share rights which do not vest, lapse on resignation or termination for cause or at the expiry of the relevant performance period, which ever comes first.
� The Board has discretion to vest share rights in the event of a change in control. The Board has determined that any outstanding share rights can vest before the end of the performance period if a "change in control" occurs. Vesting at this time will depend upon early testing of the relevant performance hurdles at that time. A "change of control" is generally an entity acquiring unconditionally more than 50% of the issued shares of the Company.
� External valuation advice from PricewaterhouseCoopers Securities Limited has been used to determine the value of the Executive Share Rights at grant date for each award. The valuation has been made using the Binomial Option Pricing Model using standard option pricing inputs such as the underlying stock price, exercise price, expected dividends, expected risk free interest rates and expected share price volatility. In addition, specific factors in relation to the likely achievement of performance hurdles and employment tenure have been taken into account.
The July 2002 award, which was tested on 30 September 2004 against the set performance hurdles, achieved the TSR performance hurdle at the 100th percentile. Accordingly, all share rights outstanding for this award vested having regard to the outstanding performance achieved.
The September 2002 award has an additional restriction that any shares acquired under this award cannot be sold prior to 30 September 2007 and any participant who resigns during this two year holding period forfeits any shares acquired under this award, unless the Board (in its absolute discretion) determines otherwise.
In September 2004, 201 senior and high potential managers were invited to participate in the Long Term Incentive Plan.
c) Long Term Incentive Plan - Outline of Specific Awards
(i) July 2002 Award
Nominated executives were awarded share rights in BlueScope Steel Limited in lieu of the awards that would otherwise have been made under BHP Billiton Limited's Long Term Incentive Plan in October 2001. For this award, a once-only increase equivalent to an additional 50% of the value of the award was made. This once-only increase was to recognise that, but for the BlueScope Steel demerger, the nominated employees would have been eligible for an award under the BHP Billiton Limited's Long Term Incentive Plan in October 2001, and the first performance period under the BlueScope Steel Long Term Incentive Plan was shorter than the three year period usually adopted under BHP Billiton Limited's plan.
Vesting Requirements
TSR Performance Hurdle
|
First Performance Period
% of Share Rights that Vest |
Second Performance Period
% of Share Rights that Vest |
|
|
|
| 80th - 100th percentile |
100% |
50% |
| 70th - < 80th percentile |
90% |
50% |
| 60th - < 70th percentile |
70% |
50% |
| 50th - < 60th percentile |
50% |
50% |
| < 50th percentile |
50% of share rights awarded lapse and 50% to be carried over to a second performance period at the Board's discretion |
None - all unvested share rights lapse immediately. |
Details of the July 2002 Award
|
Market Price Share Rights |
Nil Priced Share Rights |
|
|
|
| Grant Date |
25 July 2002 |
25 July 2002 |
Exercise Date (subject to
vesting requirements) |
From 30 September 2004 |
From 30 September 2004 |
| Latest Expiry Date |
25 July 2007 |
31 March 2006 |
| Share Rights Granted |
14,355,000 |
2,800,300 |
| Number of Participants at Grant Date |
105 |
12 |
| Number of Current Participants |
3 |
11 |
| Exercise Price |
$2.85 |
Nil |
| Fair Value Estimate at Grant Date |
$5,742,000 |
$3,276,351 |
| Share Rights Lapsed since Grant Date |
1,265,394 |
194,900 |
| Performance hurdle achieved |
100% |
100% |
| Number of Share Rights Vested |
13,089,606 |
2,605,400 |
| Number of Share Rights Exercised |
12,808,655 |
2,605,400 |
| Number of participants at Exercise Date |
100 |
11 |
| Share Rights still to be Exercised |
280,951 |
- |
1 The share rights awarded in July 2002 comprised both nil priced and market priced share rights. The exercise price established for the Market Priced Share Rights was based on the volume weighted average price of the BlueScope Steel Limited shares sold under the sale facility at the time of the demerger from BHP Billiton and BlueScope Steel shares on the Australian Stock Exchange during the first five trading days. Selected executives received Share Rights with a nil exercise price.
2 External valuation advice from PricewaterhouseCoopers Securities Limited has been used to determine the value of the Executive Share Rights at grant date. Currently, these fair values are not recognised as expenses in the financial statements. However, were these grants to have been expensed they would have been amortised over the vesting period resulting in an estimated increase in employee benefits expense of $1.04 million for the 2005 (2004: $4.2 million) financial year. Note that no adjustments to these amounts have been made to reflect actual forfeiture of shares.
(ii) September 2002 Award
Vesting Requirements
| TSR Performance Hurdle |
% of Share Rights that Vest |
|
|
| 80th - 100th percentile |
100% |
| 70th - < 80th percentile |
90% |
| 60th - < 70th percentile |
70% |
| 51st - < 60th percentile |
50% |
| < 51st percentile |
None - all unvested share rights will lapse immediately. |
Details of the September 2002 Award
| |
Nil Priced Share Rights |
|
|
| Grant Date |
30 September 2002 |
| Exercise Date (Subject to vesting requirements) |
From 1 October 2005 |
| Expiry Date |
30 September 2006 |
| Share Rights Granted |
4,751,500 |
| Number of Participants at Grant Date |
119 |
| Number of current Participants |
116 |
| Exercise Price |
Nil |
| Fair Value Estimate at Grant Date |
$4,656,470 |
| Share Rights Lapsed since Grant Date |
282,621 |
1 External valuation advice from PricewaterhouseCoopers Securities Limited has been used to determine the value of the Executive Share Rights at grant date. Currently, these fair values are not recognised as expenses in the financial statements. However, were these grants to have been expensed they would have been amortised over the vesting period resulting in an estimated increase in employee benefits expense of $1.55 million for the year ended 30 June 2005 (2004: $1.55 million). Note that no adjustment to this amount has been made to reflect actual forfeiture of shares.
(iii) September 2003 Award
Vesting Requirements
| TSR Performance Hurdle |
% of Share Rights that Vest |
|
|
| 75th - 100th percentile |
100% |
| 51st - < 75th percentile |
A minimum of 52% plus a further 2% for each increased percentage ranking. Any unvested share rights will be carried over to be assessed at subsequent performance periods. |
| < 51st percentile |
All share rights will be carried over to be assessed at subsequent performance periods. |
If the performance hurdles are not met at the end of the first performance period (or are only partially met), four subsequent performance periods will apply. The subsequent performance periods commence on 1 October 2003 and end on 31 March 2007, 30 September 2007, 31 March 2008 and 30 September 2008 respectively. Vesting at a subsequent performance period will only occur if the vesting requirements have been met and any previous percentile rankings are exceeded.
Details of the September 2003 Award
| |
Nil Priced Share Rights |
|
|
| Grant Date |
24 October 2003 (All executives excluding Managing Director and Chief Executive Officer)
13 November 2003 (Managing Director and Chief Executive Officer) |
| Exercise Date (subject to vesting requirements) |
From 1 October 2006 |
| Expiry Date |
30 September 2008 |
| Share Rights Granted |
3,183,800 |
| Number of Participants at Grant Date |
144 |
| Number of current Participants |
141 |
| Exercise Price |
Nil |
| Fair Value Estimate at Grant Date |
$9,678,752 |
| Share Rights Lapsed since Grant Date |
109,453 |
1 External valuation advice from PricewaterhouseCoopers Securities Limited has been used to determine the value of the Executive Share Rights at grant date. Currently, these fair values are not recognised as expenses in the financial statements. However, were these grants to have been expensed they would have been amortised over the vesting period resulting in an estimated increase in employee benefits expense of $3.3 million for the year ended 30 June 2005 (2004: $2.3 million). Note that no adjustment to this amount has been made to reflect actual forfeiture of shares.
(iv) September 2004 Award
Vesting Requirements
| TSR Performance Hurdle |
% of Share Rights that Vest |
|
|
| 75th - 100th percentile |
100% |
| 51st - < 75th percentile |
A minimum of 52% plus a further 2% for each percentage ranking. Any unvested share rights will be carried over to be assessed at subsequent performance periods. |
| < 51st percentile |
All share rights will be carried over to be assessed at subsequent performance periods. |
If the performance hurdles are not met at the end of the first performance period (or are only partially met), four subsequent performance periods will apply. The subsequent performance periods commence on 1 September 2004 and end on 29 February 2008, 31 August 2008, 28 February 2009 and 31 August 2009 respectively. Vesting at a subsequent performance period will only occur if the vesting requirements have been met and any previous percentile rankings are exceeded.
Details of the September 2004 Award
| |
Nil Priced Share Rights |
|
|
| Grant Date |
31 August 2004 |
| Exercise Date (subject to vesting requirements) |
From 1 September 2007 |
| Expiry Date |
31 October 2009 |
| Share Rights Granted |
2,306,400 |
| Number of Participants at Grant Date |
201 |
| Number of current Participants |
200 |
| Exercise Price |
Nil |
| Fair Value Estimate at Grant Date |
$11,139,912 |
| Share Rights Lapsed since Grant Date |
6000 |
1 External valuation advice from PricewaterhouseCoopers Securities Limited has been used to determine the value of the Executive Share Rights at grant date. Currently, these fair values are not recognised as expenses in the financial statements. However, were these grants to have been expensed they would have been amortised over the vesting period resulting in an estimated increase in employee benefits expense of $2.3 million for the year ended 30 June 2005. Note that no adjustment to this amount has been made to reflect actual forfeiture of shares.
2 The award granted on 31 August 2004 to the Managing Director and Chief Executive Officer was subject to Shareholder approval at the 2004 Annual General Meeting.
d) Special Share Rights Awards
Special Share Rights are awarded by the Board from time to time to meet specific or exceptional demands. In 2004, special share rights were awarded to two executives to facilitate the effective integration and turn around of the North America Coated and Building Products business, the effective integration of the China operations of BlueScope Butler and successful completion of Asian capital expansion. The awards have been made in the form of share rights in 2 tranches which are vested on the achievement of specific performance objectives determined by the Managing Director and Chief Executive Officer and the Chairman of the Board. The performance hurdles set are tested at the end of each performance period (i.e. 30 June 2005 for Tranche 1 and 30 June 2006 for Tranche 2). Any unvested share rights rolled over from Tranche 1 which did not meet the performance hurdles are added to the Tranche 2 award and new performance hurdles determined for the period 1 July 2005 - 30 June 2006. No tranche 1 special share rights were vested.
e) Employee Share Purchase Plan
Facility is also made available, to Australian employees only at this stage, to be provided with shares at market prices through salary sacrifice from salary or incentives/bonuses. Under the purchase plan, shares can be provided on a tax deferred basis and therefore sale or transfer is restricted. Shares provided under the Plan are entitled to participate in dividends.
1.3.5 Superannuation
BlueScope Steel operates superannuation funds in Australia, New Zealand and North America for its employees. In these locations there are a combination of defined benefit and accumulation type plans. The defined benefit schemes are closed to new members.
Contributions are also made to other international superannuation plans for employees outside of Australia, New Zealand and North America.
1.3.6 Other Benefits
Additionally, executives are eligible to participate in an annual health assessment program designed to safeguard the Company against the loss or long term absence for health related reasons.
2. RELATIONSHIP BETWEEN COMPANY PERFORMANCE AND REMUNERATION
The graph set out below outlines the performance of BlueScope Steel in terms of Total Shareholder Return compared to the performance of the S&P/ASX 100 for the same period. The TSR Index for BlueScope Steel as at 30 June 2005 was 314.9 compared to 151.2 for the S&P/ASX 100.
BLUESCOPE STEEL LIMITED
TOTAL SHAREHOLDER RETURN INDEX COMPARED TO S&P/ASX100
15/07/02 TO 30/06/05
An analysis of other Company performance and performance related remuneration data relating to the nominated senior Corporate executives set out in Section 3 over the same period are set out in the tables below:
BlueScope Steel Performance Analysis
| Measure |
30 June 2002 |
30 June 2003 |
30 June 2004 |
30 June 2005 |
|
|
|
|
|
| Share Price |
$2.85 |
$3.72 |
$6.74 |
$8.23 |
| Change in Share Price $ |
- |
$0.87 |
$3.02 |
$1.49 |
| Change in Share Price % |
- |
30.5% |
81.2% |
22.1% |
| Dividend Per Share |
N/A |
0.29 cents |
0.40 cents |
0.62 cents |
| Earnings Per Share |
N/A |
57.1 cents |
77.8 cents |
137.4 cents |
| NPAT $m |
N/A |
$452m |
$584m |
$1,007m |
| % movement |
N/A |
- |
29.2% |
72.4% |
| EBIT $m |
$160m |
$611m |
$818m |
$1388m |
| % movement |
- |
282% |
34% |
70% |
| EBITDA $m |
$412m |
$881m |
$1105m |
$1696 |
| % movement |
- |
114% |
25% |
53% |
(1) Share Price as at 15 July 2002
As reflected in the table above, over the total period:
� EBITDA has increased by 312% since 30 June 2002.
� EBIT has increased by 768% since 30 June 2002.
� Earnings per share for the two years ended 30 June 2003 to 30 June 2005 have increased by 141%.
BSL Performance Related Remuneration Analysis for Senior Corporate Executives
Measure
|
Year ended
30 June 2003 |
Year ended
30 June 2004 |
Year ended
30 June 2005 |
|
|
|
|
| Average % increase in short term incentive Payments |
1st year |
1.9 |
12.3 |
The Board Remuneration Strategy short term incentive component takes into account business unit financial performances and non financial and strategic hurdles. Market consensus on future earnings is also taken into account in setting financial targets as these take into account forecast movements in steel prices, exchange rate and other external factors likely to impact financial performance. Some participants in short term incentives have not met all of the hurdles with the result that some short term incentive payments have been below the possible maximum level. On average, the short term incentives payable to the Managing Director and Chief Executive Officer and other senior nominated executives was 100% of the potential short term incentive which could be awarded, which reflects the outstanding results achieved this year.
In relation to long term incentives, share price and earnings performance have been in the top percentile when measured against the Companies in the S&P/ASX 100 index and this performance is the key factor impacting the value of long term equity incentives and their likelihood of meeting the required hurdles for vesting.
3. SPECIFIC REMUNERATION DETAILS
3.1 Directors
Details of the audited remuneration for the year ended 30 June 2005 for each Non-Executive Director of BlueScope Steel is set out in the following table.
| |
PRIMARY |
|
POST-EMPLOYMENT |
|
|
|
|
|
|
|
| |
BASE FEE
|
|
|
|
|
| Name |
Cash |
Salary Sacrifice |
Committee Fee /
Allowance |
Other |
Superannuation |
Total |
|
$
|
$
|
$
|
$
|
$
|
$
|
| GJ Kraehe |
340,304 |
37,811 |
- |
6,678 |
11,585 |
396,378 |
| RJ McNeilly |
168,681 |
18,742 |
- |
- |
11,585 |
199,008 |
J Crabb
(resigned 27 July 2004) |
10,577 |
- |
1,269 |
- |
1,337 |
13,183 |
| DJ Grady |
73,199 |
52,839 |
20,000 |
- |
11,585 |
157,623 |
| HK McCann |
111,935 |
14,103 |
15,000 |
- |
11,585 |
152,623 |
| PJ Rizzo |
120,844 |
16,779 |
30,000 |
- |
- |
167,623 |
| Tan YP |
111,434 |
14,604 |
20,000 |
- |
11,585 |
157,623 |
3.2 Details of senior executives' (including the Managing Director and Chief Executive Officer's) remuneration
The audited information contained in the table below represents the annual remuneration for the year ended 30 June 2005 for the Managing Director and Chief Executive Officer and the six most highly remunerated executives responsible for the strategic and operational direction of the Company.
In addition there was one Business Unit executive who met the requirement for remuneration disclosure for the financial year ended 30 June 2005, being Mr Alossi, President BlueScope Buildings, China.
| |
PRIMARY |
|
POST-EMPLOYMENT |
EQUITY
|
|
|
|
|
|
|
|
|
|
|
|
| Name |
Cash Salary and Fees |
At Risk Cash Bonus |
Other |
Sub total |
Superannuation |
Share Rights
|
Total |
|
|
$ |
$ |
$ |
$ |
$ |
$ |
$ |
|
|
|
|
|
|
|
|
|
|
| EXECUTIVE DIRECTOR |
|
|
|
|
|
|
|
|
| KC Adams - Managing Director and CEO |
1,411,442 |
2,131,250 |
8,302 |
3,550,994 |
207,482 |
803,956 |
4,562,432 |
| EXECUTIVES |
|
|
|
|
|
|
|
|
LE Hockridge - President
BlueScope Steel North America
(effective 1 April 2005, formerly
President Industrial Markets) |
630,161 |
600,000 |
67,011 |
1,297,172 |
90,490 |
294,664 |
1,682,326 |
| BG Kruger - Chief Financial Officer |
525,747 |
470,000 |
- |
995,747 |
76,779 |
230,439 |
1,302,965 |
| KJ Fagg - President Market and Logistics Solutions |
526,385 |
470,000 |
- |
996,385 |
73,769 |
250,400 |
1,320,554 |
| NH Cornish - President Australian Building and Manufacturing Markets |
476,318 |
430,000 |
- |
906,318 |
69,497 |
217,821 |
1,193,636 |
| M Courtnall - President Asian Building and Manufacturing Markets |
424,029 |
380,000 |
41,686 |
845,715 |
61,811 |
187,042 |
1,094,568 |
| IR Cummin - Executive Vice President Human Resources |
406,385 |
370,000 |
1,527 |
777,912 |
56,969 |
148,931 |
983,812 |
| M Alossi - President BlueScope Buildings China |
358,455 |
505,579 |
414,811 |
1,278,845 |
12,200 |
12,850 |
1,303,895 |
(1) Refer to Section 1.3.3 for details of the at risk cash bonus (Short-Term Incentive Plan). Amounts reflect the annual cash bonus for the year ended 30 June 2005 based on actual performance. Actual annual cash bonus amounts will be paid in September 2005.
(2) Valuation of equity remuneration in the form of share rights granted, excludes the effect of tenure risk. For each award, total fair value is pro-rated over the award period, from grant date to expected vesting date.
(3) Mr Alossi's previous employment agreement provided for a bonus for the 12 months ending 31 December 2004. 50% of that bonus has been included in the table above. Further Mr Alossi was eligible for a bonus for the 6 months ending 30 June 2005, which has been included above. Mr Alossi's contract has now been aligned with the BlueScope Steel STI Plan as outlined in Section 1.3.3.
(4) Mr Alossi is a US Expatriate with BlueScope Steel China. The non-monetary benefits indicated relate to benefits arising out of his assignment in China, including medical plan, housing, foreign and US taxes.
It should be noted that effective 1 July 2005, the following senior executives assumed new positions within the BlueScope Steel Limited organisation structure, with the exception of Mr Cummin who assumes his new role effective 1 September 2005.
| Name |
New Title |
|
|
| BG Kruger |
President Australian Manufacturing Markets |
| KJ Fagg |
President Australian Building and Logistics Solutions |
| NH Cornish |
President Australian and New Zealand Industrial Markets |
| IR Cummin |
Executive Vice President People and Performance |
Share Rights granted to the Managing Director and Chief Executive Officer and the top seven most highly remunerated executives during the financial year ended 30 June 2005 were as follows:
| Name |
% of Remuneration
Consisting of
Share Rights |
Value of Share Rights
Granted during the Year
at Grant Date |
Value of Share Rights
exercised during
the year |
Value of Share Rights at
lapse date, that lapsed
during the year |
|
|
|
|
|
| DIRECTORS |
|
|
|
|
| K C Adams |
18% |
931,368 |
917,900 |
- |
| EXECUTIVES |
|
|
|
|
| L E Hockridge |
18% |
353,118 |
388,332 |
- |
| B G Kruger |
18% |
277,046 |
296,542 |
- |
| K Fagg |
20% |
277,046 |
345,988 |
- |
| N Cornish |
20% |
250,832 |
296,542 |
- |
| M Courtnall |
18% |
222,048 |
236,510 |
- |
| I Cummin |
16% |
214,338 |
- |
- |
| M Alossi |
1% |
61,680 |
- |
- |
(1) This figure is calculated on the value of share rights awarded in the year ended 30 June 2005 as a percentage of the total value of all remuneration received in that same year.
(2) External valuation advice from PricewaterhouseCoopers Securities Limited has been used to determine the value of the Executive Share Rights. The valuation has been made using the Binomial Option Pricing Model using standard option pricing inputs such as the underlying stock price, exercise price, expected dividends, expected risk free interest rates and expected share price volatility. In addition, the likely achievement of performance hurdles of the share rights have been taken into account.
(3) External valuation advice from PricewaterhouseCoopers Securities Limited has been used to determine the value of the Executive Share Rights for the July 2002 award that were exercised in the year ended 30 June 2005.
(4) Mr Hockridge and Mr Courtnall were awarded 20,000 and 10,000 Share Rights (Tranche 1) respectively under the Special Incentive award on 3 August 2004. Tranche 1 performance hurdles as at 30 June 2005 were not met. In accordance with the terms of the Special Share Rights Issue the Share Rights from Tranche 1 were rolled over into the second performance period. A further Award of 20,000 and 10,000 respectively (Tranche 2) have been awarded and both Tranches are subject to new performance hurdles as determined by the Board for the period 1 July 2005 - 30 June 2006. Refer to Section 1.3.4 (d) for further information.
The Share Rights Awarded to Executives under the July 2002 Award vested at the 100% level in September 2004.
Details of the audited Share Rights holdings for the specified executives are set out below:
| Name |
Share Rights
Balance at
30 June 2004 |
Share Rights Granted in
year ended
30 June 2005 |
Share Rights Vested in
year ended
30 June 2005 |
Share Rights Lapsed
in year ended
30 June 2005 |
Share Rights
Balance at
30 June 2005 |
|
|
|
|
|
|
| DIRECTORS |
|
|
|
|
|
| K C Adams |
1,448,800 |
181,200 |
685,000 |
- |
945,000 |
| EXECUTIVES |
|
|
|
|
|
| L E Hockridge |
552,900 |
68,700 |
289,800 |
- |
331,800 |
| B G Kruger |
425,700 |
53,900 |
221,300 |
- |
258,300 |
| K Fagg |
488,700 |
53,900 |
258,200 |
- |
284,400 |
| N Cornish |
419,200 |
48,800 |
221,300 |
- |
246,700 |
| M Courtnall |
342,300 |
43,200 |
176,500 |
- |
209,000 |
| I Cummin |
94,700 |
41,700 |
- |
- |
136,400 |
| M Alossi |
- |
12,000 |
- |
- |
12,000 |
4. EMPLOYMENT CONTRACTS
4.1 Managing Director and Chief Executive Officer - Outline Of Employment Contract
Outlined below are the key terms and conditions of employment contained within the employment contract for Mr Kirby Adams, the Managing Director and Chief Executive Officer.
Mr Adams' base employment contract conditions were determined prior to the demerger on 7 July 2002 and are regularly reviewed by the Board of BlueScope Steel. He receives an annual base pay of $1,425,000. This amount is reviewed on an annual basis in accordance with the Board's senior executive salary review policy. In addition, Mr Adams is eligible to participate in the Short Term Incentive Plan and, subject to shareholder approval, Long Term Incentive Plan awards.
Mr Adams may terminate the contract by giving three months' written notice, upon which he is entitled to his annual base pay, which has been accrued but not paid up to the date of termination, plus any vested awards under the Long Term Incentive Plan, and any other payments for which he is eligible under the Short Term Incentive Plan. The Company may terminate the contract by giving one months' written notice (or a payment in lieu of notice based on Mr Adams' annual base pay) and a gross termination payment equal to 24 months of Mr Adams' annual base pay, plus any applicable Short Term Incentive Plan and Long Term Incentive Plan awards, and reimbursement for the reasonable costs of relocation from Australia to the United States of America. The Company may also terminate the contract on 30 days' notice in the event of serious misconduct or a serious breach of the contract. In this event, Mr Adams is only entitled to his annual base pay which has accrued but not been paid up to the date of termination plus any vested Long Term Incentive Plan awards.
4.2 Other Specified Executives
Remuneration and other terms of employment for the other specified executives set out above are formalised in employment contracts which can be terminated with notice. Each of these agreements provide for the annual review of annual base pay, provision of performance-related cash bonuses, other benefits including annual health assessment, and participation, when eligible, in the Long Term Incentive Plan. The contracts provide for notice of one to six months for resignation by the executive or termination by the Company. In the event of termination by the Company other than for cause, a termination payment of 12 months pay or the Company Redundancy Policy, whichever is the greater, will apply. The Company Redundancy Policy provides for 14 weeks pay plus 2.5 weeks for each year of service.
|
| |
consolidated statement of financial performance
for the year ended 30 june 2005
|
Notes |
2005
$M |
2004
$M |
|
|
|
|
| Revenue from ordinary activities |
|
7,981.6 |
5,769.6 |
| Changes in inventories of finished goods and work in progress |
|
146.7 |
1.7 |
| Raw materials and consumables used |
|
(3,296.8) |
(2,145.6) |
| Employee benefits expense |
|
(1,347.0) |
(1,075.2) |
| Depreciation and amortisation expenses |
|
(306.1) |
(286.7) |
| Diminution in value of non-current assets |
|
(1.6) |
(1.4) |
| External services |
|
(1,093.0) |
(800.0) |
| Freight on external despatches |
|
(484.3) |
(418.7) |
| Carrying amount of non-current assets sold |
|
(9.9) |
(6.0) |
| Other expenses from ordinary activities |
|
(394.7) |
(288.7) |
| Borrowing costs expense |
|
(37.5) |
(16.8) |
| Shares of net profits of associates and joint venture partnership accounted for using the equity method |
|
196.7 |
71.2 |
|
|
|
|
| Profit from ordinary activities before income tax expense |
|
1,354.1 |
803.4 |
| Income tax expense |
|
(347.0) |
(201.6) |
|
|
|
|
| Profit from ordinary activities after income tax expense |
|
1,007.1 |
601.8 |
| Net profit attributable to outside equity interest |
|
(0.1) |
(17.7) |
|
|
|
|
| Net profit attributable to members of BlueScope Steel Limited |
|
1,007.0 |
584.1 |
|
|
|
|
| Net increase (decrease) in foreign currency translation reserve |
|
(56.7) |
12.7 |
|
|
|
|
| Total revenue, expenses and valuation adjustments attributable to members of BlueScope Steel Limited recognised directly in equity |
|
(56.7) |
12.7 |
|
|
|
|
| Total changes in equity other than those resulting from transactions with owners as owners |
|
950.3 |
596.8 |
|
|
|
|
|
|
Cents |
Cents |
| Basic earnings per share |
|
137.4 |
77.8 |
The above consolidated statement of financial performance should be read in conjunction
with the and discussion and analysis.
Discussion and analysis of consolidated statement of financial performance
A breakdown of revenue and profit from ordinary activities before income tax by reporting segment is set out in
Key points to note on the profit from ordinary activities before income tax expense are:
· Building on the strong performance of previous years, the BlueScope Steel Group has achieved a record financial result, delivering a net profit of $1,007.0 million and earnings per share of 137.4 cents.
· The Company's revenue increased $2,212.0 million to $7,981.6 million, primarily achieved through acquisitions, improved prices, and a favourable shift in mix of despatches from export to domestic. These were partly offset by a reduction in the value of USD denominated sales, due to the strengthening of the Australian dollar.
· Net profit after tax increased $422.9 million to a record $1,007.0 million. This improvement was due primarily to higher international and domestic steel prices, improved margins from North Star BlueScope Steel and a favourable shift in mix of despatches from export to domestic. These were partly offset by higher raw material and operating costs, higher planned repairs and maintenance to improved operating stability, higher business development costs and the net impact of a higher AUD/USD exchange rate on USD denominated revenues and costs.
Hot Rolled Products
· The earnings contribution from the Hot Rolled Products segment increased as a result of stronger hot rolled coil and slab pricing (to export, domestic and inter-segment customers), and a substantial increase in margins from North Star BlueScope Steel. These were partly offset by higher scrap, coking coal, iron ore, alloys and freight costs, together with an increase in repairs and maintenance expenditure to ensure reliability of operations which underpins increased production capacity together with the optimisation of asset lives.
New Zealand and Pacific Steel Products
· The earnings contribution from the New Zealand and Pacific Steel Products segment increased as a result of domestic and export price increases, higher prices for vanadium slag (a steel making by-product) and continuing strong New Zealand domestic sales volumes.
Coated and Building Products Australia
· The earnings contribution from the Coated and Building Products Australia segment was significantly affected by higher hot rolled coil and slab feed costs (from Hot Rolled Products), which compressed margins despite price increases in both domestic and export markets. Earnings were also affected by industrial action at the Western Port facility, an increase in repairs and maintenance and restructuring costs associated with the withdrawal from export tinplate. These were partly offset by a favourable shift in mix of despatches from export to domestic.
Coated and Building Products Asia
· The earnings contribution from the Coated and Building Products Asia segment was lower primarily due to an increase in business development and pre-production costs associated with developments in Vietnam, Thailand, India and China, together with operating cost increases. These were partly offset by sales volume increases as a result of market growth initiatives and the integration of BlueScope Butler China. The segment maintained gross margins despite significant increases in steel feed and coating metal costs.
Coated and Building Products North America
· Butler Manufacturing Company, a leading manufacturer of pre-engineered buildings, was acquired in April 2004, bringing a new suite of building and construction products to the Company. This new segment delivered negative earnings for the year. However, when compared with comparative period earnings normalised for discontinued operations and acquisition related costs, earnings improved $8 million. This improvement was achieved primarily through higher margins but was negatively affected by costs associated with the early closure of the Galesburg, Illinois plant and start up costs of the replacement plant at Jackson, Tennessee.
Income Tax
· The effective tax rate for the twelve months ended 30 June 2005 was 25.6% (2004: 25.1%). The tax rate differs from the Australian tax rate of 30% primarily due to the utilisation of unbooked tax losses in New Zealand, together with the utilisation of tax exemptions in our Thailand Coating operation. These were partly offset by North Star BlueScope Steel being taxed at approximately 40% (US 35% tax rate plus state taxes).
consolidated statement of financial position
as at 30 june 2005
|
Notes |
2005
$M |
2004
$M |
|
|
|
|
| Current assets |
|
|
|
| Cash assets |
|
84.6 |
119.4 |
| Receivables |
|
1,052.8 |
989.2 |
| Inventories |
|
1,152.2 |
891.4 |
| Other |
|
39.5 |
43.7 |
|
|
|
|
| Total current assets |
|
2,329.1 |
2,043.7 |
|
|
|
|
| Non-current assets |
|
|
|
| Receivables |
|
7.4 |
7.1 |
| Inventories |
|
58.6 |
71.1 |
| Investments accounted for using the equity method |
|
253.5 |
236.3 |
| Other financial assets |
|
4.6 |
4.6 |
| Property, plant and equipment |
|
3,629.0 |
3,288.6 |
| Deferred tax assets |
|
61.6 |
58.0 |
| Intangible assets |
|
112.4 |
60.1 |
| Other |
|
7.5 |
12.6 |
|
|
|
|
| Total non-current assets |
|
4,134.6 |
3,738.4 |
|
|
|
|
| Total assets |
|
6,463.7 |
5,782.1 |
|
|
|
|
| Current liabilities |
|
|
|
| Payables |
|
818.6 |
728.3 |
| Interest bearing liabilities |
|
255.7 |
416.0 |
| Current tax liabilities |
|
215.6 |
154.3 |
| Provisions |
|
263.0 |
294.7 |
| Other |
|
60.5 |
92.5 |
|
|
|
|
| Total current liabilities |
|
1,613.4 |
1,685.8 |
|
|
|
|
| Non-current liabilities |
|
|
|
| Payables |
|
5.0 |
- |
| Interest bearing liabilities |
|
620.2 |
176.7 |
| Deferred tax liabilities |
|
351.9 |
388.3 |
| Provisions |
|
372.7 |
337.7 |
|
|
|
|
| Total non-current liabilities |
|
1,349.8 |
902.7 |
|
|
|
|
| Total liabilities |
|
2,963.2 |
2,588.5 |
|
|
|
|
| Net assets |
|
3,500.5 |
3,193.6 |
|
|
|
|
| Equity |
|
|
|
| Parent entity interest |
|
|
|
| Contributed equity |
|
1,747.5 |
1,914.9 |
| Reserves |
|
(131.2) |
(77.5) |
| Retained profits |
|
1,841.0 |
1,302.9 |
|
|
|
|
| Total parent entity interest |
|
3,457.3 |
3,140.3 |
| Outside equity interest in controlled entities |
|
43.2 |
53.3 |
|
|
|
|
| Total equity |
|
3,500.5 |
3,193.6 |
|
|
|
|
The above consolidated statement of financial position should be read in conjunction with the and discussion and analysis.
Discussion and analysis of consolidated statement of financial position
Key notes on balance sheet movements are as follows:
ASSETS AND LIABILITIES
· An increase in receivables due mainly to higher sales prices.
· An increase in inventories due to higher raw material costs and timing of raw material receipts and export shipments.
· An increase in property, plant and equipment due to expenditure on new coating line facilities in Vietnam, China and a second metal coating line in Thailand and the Hot Strip Mill upgrade at Port Kembla.
· An increase in intangible assets arising from Lysaght Australia and BlueScope Water business acquisitions.
· An increase in payables due to higher capital expenditure and an increase in raw material, freight and other costs.
· An increase in provision for income tax in line with increased earnings, mainly from Australian operations.
EQUITY
· During April 2005, the company completed an off-market share buy-back of 25,856,197 shares, representing 3.5% of its issued share capital. The shares were bought back at $7.75 per share for a total cost of $202 million (includes $2 million of transaction costs). The price of $7.75 represented a 9% discount to the volume weighted average of BlueScope Steel Limited shares over the five days up to and including the closing date of the buyback.
· Shares bought back on-market totalled $125 million (15,880,095 shares).
· $37 million of share proceeds from the exercise of share rights issued in July 2002 under the senior manager long term incentive plan.
· A decrease in the exchange fluctuation reserve due to the impact of the strengthening of the AUD on foreign operations.
RELATIONSHIP BETWEEN DEBT AND EQUITY
· The current gearing ratio, calculated as net debt over net debt plus equity, is 18.4% (2004: 12.9%).
· On 1 July 2004, the Company completed a debut debt raising in the US private placement market totalling USD300 million with terms of 7 years (USD100 million) and 10 years (USD200 million).
consolidated statement of cash flows
For the year ended 30 june 2005
| |
Notes |
2005
$M |
2004
$M |
|
|
|
|
| Cash flows from operating activities |
|
|
|
| Receipts from customers |
|
8,243.9 |
5,948.3 |
| Payments to suppliers and employees |
|
(7,166.0) |
(5,099.9) |
|
|
|
|
| |
|
1,077.9 |
848.4 |
| Dividends received |
|
125.4 |
1.0 |
| Interest received |
|
3.7 |
2.6 |
| Other revenue |
|
21.0 |
43.3 |
| Borrowing costs |
|
(26.9) |
(15.8) |
| Income taxes paid |
|
(312.1) |
(119.4) |
|
|
|
|
| Net cash inflow (outflow) from operating activities |
|
889.0 |
760.1 |
|
|
|
|
| Cash flows from investing activities |
|
|
|
| Payment for purchase of controlled entities, net of cash acquired |
|
(17.8) |
(290.0) |
| Payments for property, plant and equipment |
|
(600.0) |
(289.1) |
| Payments for investments |
|
(45.2) |
(5.5) |
| Proceeds from sale of property, plant and equipment |
|
12.8 |
11.8 |
| Proceeds from sale or redemption of investments |
|
- |
6.5 |
| Net associate loan receivable repaid (advanced) |
|
(28.5) |
(11.2) |
|
|
|
|
| Net cash inflow (outflow) from investing activities |
|
(621.7) |
(577.5) |
|
|
|
|
| Cash flows from financing activities |
|
|
|
| Proceeds from issues of shares |
|
36.9 |
- |
| Share buyback |
|
(327.0) |
(259.4) |
| Employee share plan |
|
- |
(9.2) |
| Proceeds from other borrowings |
|
2,893.9 |
3,469.5 |
| Proceeds from finance leases |
|
0.6 |
- |
| Repayment of borrowings |
|
(2,541.0) |
(3,114.0) |
| Repayment of finance leases |
|
(4.5) |
(0.3) |
| Dividends paid |
|
(343.0) |
(241.6) |
| Dividends paid to outside equity interests in controlled entities |
|
(5.2) |
(3.0) |
|
|
|
|
| Net cash inflow (outflow) from financing activities |
|
(289.3) |
(158.0) |
|
|
|
|
| Net increase (decrease) in cash held |
|
(22.0) |
24.6 |
| Cash at the beginning of the financial year |
|
118.1 |
91.0 |
| Effects of exchange rate changes on cash |
|
(13.1) |
2.5 |
|
|
|
|
| Cash at the end of the financial year |
|
83.0 |
118.1 |
|
|
|
|
The above consolidated statement of cash flows should be read in conjunction with the and discussion and analysis.
Discussion and analysis of consolidated statement of cash flows
CASH FLOWS FROM OPERATING ACTIVITIES
The increase in net operating cash flows reflects an increase in operating cash profits partly offset by an increase in net working capital. The increase in net working capital primarily reflects:
· An increase in inventory due to higher raw material costs and the timing of raw material receipts and export shipments.
· An increase in receivables mainly due to higher prices.
· Partially offset by higher operating payables due to increased raw material, freight and other costs.
Other major movements in operating activities are:
· Dividend payments of $123 million received from North Star BlueScope Steel.
· Income tax payments were $193 million higher primarily due to increased profits earned from Australian operations. Tax losses and other tax exemptions exist in our New Zealand and Asian operations.
CASH FLOWS FROM INVESTING ACTIVITIES
Major movements in investing cash flows are as follows:
· The prior year cash flow included $278 million for the acquisition of the Butler Manufacturing Company.
· Payments for property, plant and equipment has increased by $311 million due mainly to expenditure on new coating line facilities in Vietnam and China, a second metal coating line in Thailand and the Hot Strip Mill upgrade at Port Kembla.
· Lysaght Australia and BlueScope Water business acquisitions.
· A loan to North Star BlueScope Steel was fully repaid during the year.
CASH FLOWS FROM FINANCING ACTIVITIES
Major financing cash flows are as follows:
· The payment of $343 million in dividends (2004: $242 million). This amount includes $75 million (2004: $53.8 million) in special dividend payments.
· $327 million of shares bought back (2004: $259 million).
· $37 million of share proceeds from the exercise of share rights issued in July 2002 under the senior manager long term incentive plan.
· The company borrowed an additional $349 million of debt.
|
| |
NOTE 1
BASIS OF PREPARATION OF THE CONCISE FINANCIAL REPORT
The concise financial report has been prepared in accordance with the requirements of the Corporations Act 2001 and Accounting Standard AASB 1039 "Concise Financial Reports".
The concise financial report relates to the consolidated entity incorporating the assets and liabilities of all entities controlled by BlueScope Steel Limited as at 30 June 2005 and the results of all controlled entities for the year then ended. The accounting policies adopted are consistent with those of the previous year.
ROUNDING OF AMOUNTS
The company is of a kind referred to in Class Order 98/0100, issued by the Australian Securities and Investments Commission, relating to the rounding off of amounts in financial reports. Amounts in the concise financial report have been rounded off in accordance with that Class Order to the nearest hundred thousand dollars.
Note 2
Australian equivalents to International Financial Reporting Standards (AIFRS)
The Australian Accounting Standards Board (AASB) is adopting Australian equivalents to International Financial Reporting Standards (AIFRS) for application to reporting periods beginning on or after 1 January 2005. The adoption of AIFRS will be first reflected in the consolidated entity's financial statements for the half-year ending 31 December 2005 and the year ending 30 June 2006.
Entities complying with AIFRS for the first time are required to restate their comparative financial statements to reflect the application of AIFRS. The majority of AIFRS transition adjustments will be made retrospectively against opening retained earnings at 1 July 2004.
BlueScope Steel Limited is well advanced in transitioning its accounting policies, systems and financial reporting from current Australian accounting standards.
Set out below are the key areas where accounting policies are expected to change on adoption of AIFRS and our best estimate of the quantitative impact on the changes on total equity as at the date of transition and 30 June 2005 and on net profit for the year ended 30 June 2005. The amounts disclosed are the company's best estimates as at the date of preparing the year-end financial report. These figures could change due to potential amendments to, and interpretations of, current AIFRS by the standard setters together with ongoing work undertaken by the company's AIFRS project team.
(a) RECONCILIATION OF EQUITY AS PRESENTED UNDER AGAAP TO THAT UNDER AIFRS
 |
|
Consolidated |
|
|
|
|
|
Notes |
30 Jun 2005 |
1 Jul 2004 |
|
|
$M |
$M |
|
|
|
|
| Total equity under AGAAP |
|
3,500.5 |
3,193.6 |
| Adjustments to retained earnings (net of tax) |
|
|
|
| Defined benefit superannuation |
|
(193.2) |
(130.5) |
| Impairment of assets |
|
(125.7) |
(71.6) |
| Income tax methodology |
|
86.3 |
80.6 |
| Foreign currency translation |
|
(12.6) |
- |
| Business combinations |
|
5.0 |
- |
| Share based payments |
|
(9.0) |
(2.6) |
| Equity accounting |
|
(0.1) |
0.7 |
| Opening exchange fluctuation reserve |
|
(77.5) |
(77.5) |
| Adjustments to other reserves (net of tax) |
|
|
|
| Share based payments |
|
9.0 |
2.6 |
| Opening exchange fluctuation reserve |
|
77.5 |
77.5 |
|
|
|
|
| Total equity under AIFRS |
|
3,260.2 |
3,072.8 |
| Estimated change $m |
|
(240.3) |
(120.8) |
| Estimated change % |
|
(6.9%) |
(3.8%) |
(b) RECONCILIATION OF NET PROFIT AS PRESENTED UNDER AGAAP TO THAT UNDER AIFRS
| |
|
Consolidated |
| |
|
|
| |
Notes |
Year ended
30 Jun 2005 |
| |
|
$M |
|
|
|
| Net profit as reported under AGAAP |
|
1,354.1 |
| Defined benefit superannuation |
|
19.8 |
| Impairment of assets |
|
(77.2) |
| Foreign currency translation |
|
22.0 |
| Business combinations |
|
4.9 |
| Share based payments |
|
(6.4) |
| Equity accounting |
|
(0.9) |
|
|
|
| Net profit before tax under AIFRS |
|
1,316.3 |
| Income tax (expense)/benefit - AGAAP |
|
(347.0) |
| Income tax (expense)/benefit - AIFRS Adjustment |
|
12.7 |
|
|
|
| Net profit after tax under AIFRS |
|
982.0 |
| Net profit after tax under AGAAP |
|
1,007.1 |
|
|
|
| Estimated change to net profit after tax $m |
|
(25.1) |
| Estimated change to net profit after tax % |
|
(2.5%) |
(i) Defined benefit superannuation
Under AASB 119 Employee Benefits, employer sponsors are required to recognise the net surplus or deficit in employer sponsored defined benefit superannuation funds as an asset or liability. This asset or liability is measured as the present value of the defined benefit obligation at the reporting date plus unrecognised actuarial losses (less unrecognised actuarial gains) less the fair value of the superannuation fund's assets at that date. The present value of the defined benefit obligation is based on expected future payments which arise from membership of the fund to the reporting date, calculated annually by independent actuaries. Consideration is given to expected future wage and salary levels, experience of employee departures and periods of service.
The requirements of AASB 119 change the group's current accounting policy whereby a liability is only recognised where a legal obligation exists and the defined benefit superannuation expense matches the company contribution. Under AASB 119, the defined benefit superannuation expense is actuarially determined and includes current service cost, interest cost, and plan expenses offset by employee contributions and the expected return on fund assets. This expense is grossed up for any contributions tax payable (Australia 15%, New Zealand 33%).
At 30 June 2005, an actuarially determined liability is to be recorded for the deficit in the New Zealand defined benefit superannuation fund and a small asset for the Australian defined benefit superannuation fund. Due to existing legal obligations arising from defined benefit funds in the Coated and Building Products North America Group a liability for the defined benefit shortfall was taken up under AGAAP. However, an additional liability is required to be recognised due to the requirements of AASB 119 to discount the accrued benefit liability using the corporate bond rate (or equivalent) which is lower than the expected return on the fund's assets.
Actuarial valuations have been undertaken for each defined benefit superannuation fund in the Group. A breakdown of the AASB 119 adjustment for the surplus and shortfalls of the Group's funds, including the associated tax adjustment, is as follows:
| |
Consolidated |
| |
30 June 2005 |
1 Jul 2004 |
| |
$M |
$M |
|
|
|
| Australia entities |
0.5 |
(14.3) |
| New Zealand Steel |
(168.7) |
(116.6) |
| Coated and Building Products North America |
(40.2) |
(6.3) |
| Deferred tax asset / liability |
15.2 |
6.7 |
|
|
|
| Net adjustment |
(193.2) |
(130.5) |
|
|
|
The increase in the liability from July 2004 is primarily due to a reduction in corporate bond interest rates in New Zealand and North America.
The AIFRS balance sheet asset and liability to be recognised under AASB 119 for the Australian and New Zealand defined benefit superannuation fund positions differs from the information disclosed in Note 38 to the full financial report due to:
� AASB 119 requiring the fund surplus or deficit to be grossed up for employer contributions tax (Australia 15%, New Zealand 33%); and
� the accrued benefits liability is to be discounted using a corporate bond rate with terms to maturity that match, as closely as possible, the estimated future cash outflows.
Under current AGAAP, the accrued benefits liability is not grossed up for employer contribution tax and is discounted using the expected return on the fund assets, which is typically a higher rate than the corporate bond rate.
In December 2004, AASB 119 was reissued to provide options in accounting for actuarial gains and losses by allowing either a direct adjustment against retained earnings, a progressive profit and loss 'corridor' approach or immediate recognition in the profit and loss. The company intends to early adopt the revised standard to enable actuarial gains and losses to be taken directly to retained earnings. The post tax amount to be taken to retained earnings as an actuarial loss at 30 June 2005 is $80.2M (pre tax $92.9M).
The company will recognise a $19.8M lower employment cost in the year ended June 2005 under AIFRS as current company contributions are in excess of the actuarial determined expense. This benefit is split between Hot Rolled Products $6.7M, Coated and Building Products Australia $5.1M, Corporate and Group $1.2M and New Zealand and Pacific Steel Products $6.8M.
(ii) Impairment of assets
AASB 136 Impairment of Assets determines the recoverable amount of cash generating units by assessing the higher of fair value less costs to sell and value in use. In determining value in use, future cash flows are discounted using a risk adjusted pre-tax discount rate. Cash generating units (CGUs) are described as the smallest group of assets that generate cash flows from continuing use that are largely independent.
BlueScope Steel currently assesses the recoverable value of income generating units (IGUs) using future cash flows discounted at a pre-tax companywide discount rate. IGUs are defined as a group of assets working together to generate cash flows.
The CGU approach requires certain assets to be assessed for recoverability on a standalone basis rather than being grouped into an IGU with the discount rate including a country risk premium. Both of these differences increase the possibility of certain BlueScope Steel assets being impaired.
The company has defined its CGUs, reassessed its impairment testing policy and tested all assets for impairment as at transition date and at 30 June 2005. This assessment has necessitated a $102.3M ($71.6M net of tax) impairment write-down for the Packaging Products CGU at 1 July 2004 and an additional $82.3M ($57.6M net of tax) writedown at 30 June 2005. The Packaging Products operational assets will have been written down to nil value at 30 June 2005 under AIFRS.
As a result of the 1 July 2004 write-down, depreciation expense will be $5.1M lower for the year ended 30 June 2005.
Under AGAAP, Packaging Products is grouped with other Australian steel manufacturing assets (Port Kembla Steelworks, Springhill and Western Port operations), which was treated as an IGU, and therefore Packaging Products was not tested for impairment on a standalone basis. Packaging Products is impaired on a standalone basis primarily as a result of low growth and margin compression since the facility was upgraded in the 1990's and further impaired at 30 June 2005 due to increases in unit costs following the withdrawal from export tinplate. The company continues to operate these assets and is investigating ways of improving their profitability.
The reduction in property plant and equipment will be attributable to the Coated and Building Products Australia reporting segment.
(iii) Income tax methodology
AASB 112 Income Taxes requires all tax assets to be recognised if they are probable of realisation. Probable is defined as more likely than not. Under current Australian accounting standards income tax losses can only recognised if they are considered to be virtually certain of realisation. The company has reassessed its accounting policy for the recognition of tax assets in accordance with AASB 112 and recognised an additional tax benefit of $87.5M in the opening AIFRS balance sheet at 1 July 2004 (30 June 2005 $86.3M). As a result of booking this additional benefit, the company expects to commence recognising a tax expense on New Zealand Steel's profit during the second half of FY 2006.
A further change arising from implementing AASB 112 is the requirement to use the balance sheet liability method and to tax effect fair value adjustments arising from business combinations (refer point ). The balance sheet approach focuses on the taxation of transactions and other events that affect amounts recognised in either the Balance Sheet or a tax-based balance sheet.
As tax assets are not allocated to reporting segments in accordance with AASB 114 Segment Reporting this adjustment will not impact our individual reporting segments.
(iv) Foreign currency translation
AASB 121 Effect of Changes in Foreign Exchange Rates requires exchange gains and losses arising from loan balances, including intercompany balances, to remain in the consolidated income statement unless they form part of a net investment in a foreign operation. If these tests are met, the exchange fluctuation is able to be reported in a separate component of equity and would be realised upon disposal of the foreign operation.
The company's foreign currency loans, including intercompany loans, not denominated in the functional currency of the business do not currently meet the tests required under AASB 121 for a hedge of a net investment of a foreign operation resulting in exchange fluctuations on loan balances being taken to the income statement. Under AGAAP these items have been recorded against the exchange fluctuation reserve.
Management has undertaken a thorough review of the future impact on the income statement from foreign currency exposures arising from the changes identified above. Future foreign currency exposure is to be managed through balancing foreign exchange debt with foreign exchange intercompany balances and no material earnings volatility is expected.
The profit and loss impact arising from exchange rate fluctuations on loan balances is to be allocated to the Corporate and Group reporting segment.
(v) Business combinations
Under AASB 3 Business Combinations, goodwill will no longer be amortised but instead be subject to annual impairment testing. This has resulted in a change in the group's accounting policy that currently amortises goodwill over its useful life not exceeding 20 years. Impairment testing as at 1 July 2004 and 30 June 2005 have confirmed no impairment of goodwill.
The company has elected to apply the exemption under AASB 1 First-time Adoption of Australian Equivalents to International Financial Reporting Standards to not restate pre 1 July 2004 business combinations in accordance with AASB 3. AASB 3 applies more stringent tests in identifying acquired intangible assets than current Australian accounting standards. This will result in a lower goodwill number being recorded on post 1 July 2004 acquisitions. AASB 136 Intangible Assets requires intangible assets that do not have indefinite lives to be amortised over their useful life.
Consistent with AASB 112 Income Taxes, business combinations post 1 July 2004 are required to incorporate the tax effect of fair value adjustments. This impacts the amount of goodwill recognised.
(vi) Share based payments
Under AASB 2 Share-based Payment, the company is required to expense the fair value of share rights and awards granted to employees as remuneration over the expected vesting period. This standard applies to all share rights and awards issued after 7 November 2002 which have not vested as at 1 January 2005. BlueScope Steel issues share rights to senior executives in the organisation as part of its remuneration strategy which focuses on performance, accountability and aligning performance-related reward with the value delivered to shareholders.
AASB 2 requires the fair value of the share rights granted to executives in September 2003 and September 2004, and any subsequent grants, to be expensed over the expected vesting period with a corresponding increase in an equity reserve. No tax deduction is allowed for the amount expensed. The fair values and other details on share rights granted by BlueScope Steel are disclosed in the Remuneration Report.
A minor component of the September 2003 and September 2004 Employee Share Ownership Program (ESOP) requires BlueScope Steel shares to be issued to employees in certain countries three years from the grant date. The fair value of the future share issue is required to be expensed over the remaining vesting period with a corresponding increase in an equity reserve. Future share ownership programs will require the fair value granted to be expensed to the profit and loss over the vesting period. Under current Australian accounting standards, the shares would have been issued at nil cost and no expense recognised.
(vii) Equity accounting
Under AASB 128 Investments in Associates, where an investor holds 20% or more of the voting power of the investee, it is presumed that the investor has significant influence, unless it can be clearly demonstrated that this is not the case. The company holds some minor investments in New Zealand Steel whereby equity accounting was not applied with revenue being brought to account when dividends were received.
(viii) Exchange fluctuation reserve
AASB 121 The Effects of Changes In Foreign Exchange Rates introduces a new requirement where upon disposal of a foreign operation the cumulative translation difference for that operation must be taken to the income statement as part of the gain or loss on disposal. Under current Australian Accounting Standards, the cumulative translation difference pertaining to the operation disposed would be transferred directly to retained earnings without impacting the income statement.
In accordance with AASB 1, the company has elected to restate the exchange fluctuation reserve to nil on transition to AIFRS. In adopting this exemption the 1 July 2004 opening exchange fluctuation reserve balance will be transferred directly to opening retained earnings.
(c) RESTATED AIFRS STATEMENT OF CASH FLOWS FOR THE YEAR ENDED 30 JUNE 2005
No material impacts are expected to the cash flows presented under AGAAP on adoption of AIFRS.
(d) OTHER IMPACTS FROM ADOPTION OF AIFRS
(i) Hedge accounting
AASB 139 Financial Instruments: Recognition and Measurement states that in order to achieve a qualifying hedge, the company is required to meet the following criteria:
- Identify the type of hedge;
- Identify the hedged item or transaction;
- Identify the nature of the risk being hedged;
- Identify the hedging instrument;
- Demonstrate that the hedge has and will continue to be effective; and
- Document the hedging relationship.
The accounting principles outlined in AASB 139 do not require retrospective application as management have elected to apply the exemption in AASB 1 and will therefore apply from 1 July 2005. The project team is in the process of determining the impact that adopting the standard would have on the financial statements of the Group. The impact of this standard is not expected to have a material impact on the financial statements of the Group given the low level of hedging activity undertaken.
(ii) Sale of receivables program
AASB 139 Financial Instruments: Recognition and Measurement only allows financial assets to be derecognised where an entity transfers substantially all the risks and rewards of ownership of the financial asset. The Group's sale of receivables program does not currently meet the derecognition requirements. As a result, the program will be recorded separately as a liability rather than an offset against receivables and the expense of running the program will be shown as an interest cost rather than an operating expense.
As a result of the exemption to be applied in AASB 1, these requirements will be implemented from 1 July 2005. If the principles were applied to the 30 June 2005 balance sheet, current receivables would have increased by $140 million with a corresponding increase in current interest bearing liabilties.
(iii) Non-operating software
AASB 138 Intangible Assets requires computer software that is not an integral part of computer hardware or is not integral to the operation of a piece of machinery to be classified as an intangible asset. BlueScope Steel currently discloses all capitalised computer software as property, plant and equipment.
A reclassification of non-operating software will reduce the net tangible assets of the company with a corresponding increase in intangible assets. The 30 June 2005 net book value of software to be classified as an intangible asset is approximately $75 million.
Note 3
Segment information
BUSINESS SEGMENTS
The consolidated entity has five business reporting segments: Hot Rolled Products, Coated and Building Products Australia, New Zealand and Pacific Steel Products (formerly New Zealand Steel), Coated and Building Products Asia and Coated and Building Products North America.
Hot Rolled Products
Hot Rolled Products includes the Port Kembla Steelworks, a steel making operation with an annual production capacity of approximately 5.1 million tonnes of crude steel. The Port Kembla Steelworks manufactures and distributes slab, hot rolled coil and plate. Slab and hot rolled coil is supplied to Coated and Building Products Australia for further processing, as well as to other domestic and export customers.
The segment also includes a 50% interest in the North Star BlueScope Steel joint venture, a steel mini-mill in the United States, and a 47.5% shareholding in Castrip LLC.
New Zealand and Pacific Steel Products (formerly New Zealand Steel)
The New Zealand Steel operation at Glenbrook, New Zealand, produces a full range of flat steel products for both domestic and export markets. It has an annual production capacity of 0.6 million tonnes.
This segment also includes facilities in New Caledonia, Fiji and Vanuatu which manufacture and distribute the Lysaght range of products.
Coated and Building Products Australia
Coated and Building Products Australia markets a range of products and material solutions to the Australian building and construction industry and is also a key supplier to the Australian automotive sector, major white goods manufacturers and general manufacturers. Coated and Building Products Australia is a leader in metallic coating and painting technologies supplying a wide range of branded products such as COLORBOND® pre-painted steel, ZINCALUME® zinc/aluminium alloy-coated steel and the LYSAGHT® range of building products. The Coated and Building Products business comprises two main metallic coating production facilities at Springhill in New South Wales and Western Port in Victoria together with a network of manufacturing and distribution facilities throughout Australia.
The segment also includes Packaging Products, an operation producing tinplate in Australia which is used by the packaging industry in applications for food, beverages, paint, oil and other steel packaging.
Coated and Building Products Asia
Coated and Building Products Asia manufactures and distributes a range of metallic coated and painted steel products primarily to the building and construction industry and to some sections of the manufacturing industry across Asia.
On 27 April 2004, BlueScope Steel Limited acquired the Butler Manufacturing Company, which includes BlueScope Butler China, a business which designs, manufacturers and markets pre-engineered steel building systems and components across China. In addition, Vistawall has operations in China which manufacture and sell extruded aluminium and glass products for the building and construction sector.
Coated and Building Products North America
On 27 April 2004, BlueScope Steel Limited acquired Butler Manufacturing Company, a leading designer and manufacturer of pre-engineered steel building systems for the non-residential market with operations in North America and China. This segment includes the North American operations and has two main divisions: the North American Buildings Group, which designs, manufactures and markets pre-engineered steel buildings and component systems; and Vistawall, which manufactures and sells extruded aluminium and glass products for the building and construction sector.
Corporate and Group
Corporate and Group relates primarily to logistics and corporate activities
Intersegment pricing and segment accounting policies
Intersegment sales are made on a commercial arms-length basis. Segment accounting policies are the same as the consolidated entity's policies outlined in the full financial report.
note 3 segment information
Primary reporting - business segments
| |
Hot Rolled Products |
New Zealand Steel and Pacific Steel Products |
Coated and Building Products Australia |
Coated and Building Products
Asia |
Coated and Building Products North America |
Corporate and Group |
Consolidated |
2005
|
$M
|
$M
|
$M
|
$M
|
$M
|
$M
|
$M
|
| Sales to external customers |
2,112.7 |
615.5 |
2,984.9 |
999.3 |
1,132.1 |
96.2 |
7,940.7 |
| Intersegment sales |
1,826.8 |
140.9 |
205.4 |
52.0 |
2.3 |
263.7 |
2,491.1 |
| Intersegment elimination |
|
|
|
|
|
|
(2,491.1) |
|
|
|
|
|
|
|
|
| Total sales revenue |
3,939.5 |
756.4 |
3,190.3 |
1,051.3 |
1,134.4 |
359.9 |
7,940.7 |
| Other revenue |
1.9 |
9.0 |
2.0 |
3.1 |
22.5 |
5.4 |
43.9 |
| Intersegment elimination |
|
|
|
|
|
|
(3.0) |
|
|
|
|
|
|
|
|
| Total other revenue |
1.9 |
9.0 |
2.0 |
3.1 |
22.5 |
5.4 |
40.9 |
|
|
|
|
|
|
|
|
| Total segment revenue |
3,941.4 |
765.4 |
3,192.3 |
1,054.4 |
1,156.9 |
365.3 |
7,981.6 |
|
|
|
|
|
|
|
|
| Segment result |
1,338.5 |
182.8 |
(115.7) |
81.8 |
(19.7) |
(70.2) |
1,397.5 |
| Intersegment elimination |
|
|
|
|
|
|
(9.1) |
|
|
|
|
|
|
|
|
| Total segment result |
1,338.5 |
182.8 |
(115.7) |
81.8 |
(19.7) |
(70.2) |
1,388.4 |
|
|
|
|
|
|
|
|
| Unallocated revenue less unallocated expenses |
|
|
|
|
|
|
(34.3) |
|
|
|
|
|
|
|
|
| Profit from ordinary activities before income tax expense |
|
|
|
|
|
|
1,354.1 |
| Income tax expense |
|
|
|
|
|
|
(347.0) |
|
|
|
|
|
|
|
|
| Net profit |
|
|
|
|
|
|
1,007.1 |
|
|
|
|
|
|
|
|
| Segment assets |
2,593.9 |
578.7 |
1,917.7 |
1,167.6 |
472.2 |
47.3 |
6,777.4 |
|
|
|
|
|
|
|
|
| Unallocated assets |
|
|
|
|
|
|
48.8 |
| Intersegment elimination |
|
|
|
|
|
|
(362.5) |
|
|
|
|
|
|
|
|
| Total assets |
|
|
|
|
|
|
6,463.7 |
|
|
|
|
|
|
|
|
| Segment liabilities |
564.1 |
104.3 |
490.4 |
289.4 |
238.0 |
58.1 |
1,744.3 |
|
|
|
|
|
|
|
|
| Unallocated liabilities |
|
|
|
|
|
|
1,496.2 |
| Intersegment elimination |
|
|
|
|
|
|
(277.3) |
|
|
|
|
|
|
|
|
| Total liabilities |
|
|
|
|
|
|
2,963.2 |
|
|
|
|
|
|
|
|
| Investments in associates and joint venture partnership |
246.9 |
- |
- |
1.9 |
4.7 |
- |
253.5 |
|
|
|
|
|
|
|
|
| Acquisition of property, plant and equipment, intangibles and other non-current segment assets |
140.1 |
36.8 |
175.2 |
342.9 |
50.5 |
1.7 |
747.2 |
|
|
|
|
|
|
|
|
| Depreciation and amortisation expense |
131.7 |
28.2 |
98.7 |
25.2 |
20.4 |
1.9 |
306.1 |
|
|
|
|
|
|
|
|
| Other non-cash expenses |
1.0 |
1.3 |
3.9 |
0.9 |
2.9 |
- |
10.0 |
|
|
|
|
|
|
|
|
(1) The Hot Rolled Products segment results includes $194 million share of net profits of joint venture partnership.
(2) External borrowings, sale of receivables program, cash and tax balances are classified as unallocated.
note 3 segment information
Primary reporting - business segments continued
| |
Hot Rolled Products |
New Zealand Steel and Pacific Steel Products |
Coated and Building Products Australia |
Coated and Building Products
Asia |
Coated and Building Products North America |
Corporate and Group |
Consolidated |
2004
|
$M
|
$M
|
$M
|
$M
|
$M
|
$M
|
$M
|
| Sales to external customers |
1,517.3 |
514.7 |
2,742.3 |
663.8 |
191.1 |
108.9 |
5,738.1 |
| Intersegment sales |
1,321.3 |
75.5 |
141.2 |
34.8 |
0.4 |
264.0 |
1,837.2 |
| Intersegment elimination |
|
|
|
|
|
|
(1,837.2) |
|
|
|
|
|
|
|
|
| Total sales revenue |
2,838.6 |
590.2 |
2,883.5 |
698.6 |
191.5 |
372.9 |
5,738.1 |
| Other revenue |
4.7 |
1.6 |
3.2 |
11.5 |
2.0 |
9.2 |
32.2 |
| Intersegment elimination |
|
|
|
|
|
|
(0.7) |
|
|
|
|
|
|
|
|
| Total other revenue |
4.7 |
1.6 |
3.2 |
11.5 |
2.0 |
9.2 |
31.5 |
|
|
|
|
|
|
|
|
| Total segment revenue |
2,843.3 |
591.8 |
2,886.7 |
710.1 |
193.5 |
382.1 |
5,769.6 |
|
|
|
|
|
|
|
|
| Segment result |
563.8 |
62.1 |
192.9 |
104.0 |
(8.8) |
(64.0) |
850.0 |
| Intersegment elimination |
|
|
|
|
|
|
(32.1) |
|
|
|
|
|
|
|
|
| Total segment result |
563.8 |
62.1 |
192.9 |
104.0 |
(8.8) |
(64.0) |
817.9 |
|
|
|
|
|
|
|
|
| Unallocated revenue less unallocated expenses |
|
|
|
|
|
|
(14.5)
|
| Profit from ordinary activities before income tax expense |
|
|
|
|
|
|
803.4 |
| Income tax expense |
|
|
|
|
|
|
(201.6)
|
| Net profit |
|
|
|
|
|
|
601.8
|
| Segment assets |
2,382.6 |
538.7 |
1,684.0 |
813.2 |
518.9 |
45.1 |
5,982.5 |
|
|
|
|
|
|
|
|
| Unallocated assets |
|
|
|
|
|
|
124.7 |
| Intersegment elimination |
|
|
|
|
|
|
(325.1)
|
| Total assets |
|
|
|
|
|
|
5,782.1
|
| Segment liabilities |
524.1 |
97.7 |
428.7 |
204.0 |
286.9 |
70.7 |
1,612.1 |
|
|
|
|
|
|
|
|
| Unallocated liabilities |
|
|
|
|
|
|
1,225.6 |
| Intersegment elimination |
|
|
|
|
|
|
(249.2)
|
| Total liabilities |
|
|
|
|
|
|
2,588.5
|
| Investments in associates and joint venture partnership |
232.1 |
- |
- |
- |
4.2 |
- |
236.3 |
|
|
|
|
|
|
|
|
| Acquisition of property, plant and equipment, intangibles and other non-current segment assets |
64.9 |
27.9 |
101.3 |
162.9 |
176.0 |
3.5 |
536.5 |
|
|
|
|
|
|
|
|
| Depreciation and amortisation expense |
127.9 |
36.1 |
93.6 |
21.9 |
3.6 |
3.6 |
286.7 |
|
|
|
|
|
|
|
|
| Other non-cash expenses |
(0.5) |
(0.6) |
1.6 |
0.8 |
0.2 |
- |
1.5 |
|
|
|
|
|
|
|
|
(1) Minor changes have been made to the comparative period results reported in the 30 June 2004 concise financial report.
These changes relate to the reorganisation of Lysaght Pacific and International Trading activities to align with current management responsibilities.
(2) The Hot Rolled Products segment result includes $71.1 million share of net profits of joint venture partnership.
(3) External borrowings, sale of receivables program, cash and tax balances are classified as unallocated.
(4) Includes property, plant and equipment acquired on 27 April 2004 from the purchase of the Butler Manufacturing for $186.1million.
This is reflected in the Coated and Building Products North America and Asia segments.
note 4
revenue
|
2005
|
2004 |
| |
$M |
$M |
|
|
|
| Sale of goods |
7,780.9 |
5,614.5 |
| Services |
159.8 |
123.6 |
|
|
|
| Sales revenue |
7,940.7 |
5,738.1 |
| Other revenue |
40.9 |
31.5 |
|
|
|
| Total revenue |
7,981.6 |
5,769.6 |
|
|
|
note 5
dividends
| |
2005 |
2004 |
| |
$M |
$M |
|
|
|
| Total dividends |
343.0 |
241.6 |
|
|
|
As at 30 June 2005, the company's franking credits available for subsequent years is $257.8 million (2004: $147.4 million). The franking credits balance includes franking credits that are expected to arise from the payment of income tax payable as at the end of the financial year.
The directors have declared a fully franked final dividend of 24 cents and a fully franked special dividend of 20 cents per fully paid ordinary share. The estimated final dividend payable of $170 million and the special dividend payable of $142 million, to be paid on 24 October 2005 (record date 5 October 2005), have not been recognised as a liability at 30 June 2005.
A fully franked final dividend of 18 cents ($134.9 million) and a fully franked special dividend of 10 cents ($74.9 million) per fully paid ordinary share was paid on 18 October 2004. A fully franked interim dividend of 18 cents per fully paid ordinary share was paid on 4 April 2005 ($133.2 million).
note 6
earnings per share
|
2005 |
2004 |
| |
Cents |
Cents |
|
|
|
| Basic earnings per share |
137.4 |
77.8 |
|
|
|
There is no diluted earnings per share impact from the senior managers long term incentive plan disclosed in the Remuneration Report as it is the current practice of the company to satisfy these entitlements through the buyback and cancellation of an equivalent number of BlueScope Steel Limited issued shares.
|
2005
|
2004
|
| |
Number |
Number |
|
|
|
| Weighted average number of shares |
|
|
| Weighted average number of ordinary shares used as the denominator in calculating basic earnings per share |
733,031,445 |
750,542,940 |
|
|
|
| |
2005 |
2004 |
| |
$M |
$M |
|
|
|
| Reconciliation of earnings used in calculating earnings per share |
|
|
| Basic earnings per share |
|
|
| Net profit |
1,007.1 |
601.8 |
| Net profit attributable to outside equity interest |
(0.1) |
(17.7) |
|
|
|
| Earnings used in calculating basic earnings per share |
1,007.0 |
584.1 |
|
|
|
note 7
movements in ordinary share capital
|
2005
|
2004
|
2005 |
2004 |
| |
Shares |
Shares |
$M |
$M |
|
|
|
|
|
| Opening balance |
732,320,847 |
784,685,949 |
1,914.9 |
2,182.1 |
| Share buyback |
(41,736,292) |
(52,365,102) |
(204.2) |
(257.7) |
| Long term incentive plan |
15,414,055 |
- |
36.5 |
- |
| Employee share plan |
1,943,100 |
- |
0.4 |
(9.2) |
| Less: Transaction costs arising on share buyback |
|
|
0.1 |
0.3 |
|
|
|
|
|
| |
707,941,710 |
732,320,847 |
1,747.5 |
1,914.9 |
|
|
|
|
|
SHARE BUYBACK
(i) On-market share buyback.
In August 2004, the company announced its intention to buyback on-market 18.4 million shares. Up until 30 April 2005 the company purchased on-market 9,534,633 shares at an average market price of $7.86 per share. In May 2005, the company announced the maximum number for the on-market share buyback program would be increased to 35 million shares. A total of 15,880,095 shares were purchased for the 12 months at an average price of $7.83 per share.
The previous year's share buyback reflects the publicly announced on-market share buyback program, which concluded in March 2004.
(ii) Off-market share buyback.
On 19 April 2005, the company outlayed $200.4 million buying back 3.5% of its issued capital at $7.75 per share which represented a 9% discount to the volume weighted average share price over the five-day period to 8 April 2005.
In accordance with the principles outlined in UIG 22 "Accounting for share Buybacks of No Par Value Shares", the capital component of $3.07 per share has been debited against the Share Capital Account while the remaining amount, including transaction costs of $1.7 million has been debited against retained earnings.
EMPLOYE SHARE PLAN
In September 2004, the company issued 150 BlueScope Steel Limited shares at nil cost to 12,954 eligible employees (1,943,100 shares). In September 2003, the company provided 200 BlueScope Steel shares at nil cost to 9,403 eligible employees (1,880,600 shares). An equivalent number of shares were bought back at $4.88 per share. The objective of these share issues is to recognise and reward employees for their contribution to the BlueScope Steel's financial results and workplace safety performance and provide them with the opportunity to become long term shareholders.
SHARE RIGHTS
The long term incentive plan is an award of share rights to eligible senior managers. The full details of the operation of the plan can be found in the Remuneration Report. In September 2004, 12,808,655 shares were issued at $2.85 per share and 2,605,400 shares were issued at nil cost in accordance with the term outlined in the July 2002 award.
note 8
retained profits
|
Notes
|
2005 |
2004 |
| |
|
$M |
$M |
|
|
|
|
| Retained profits at the beginning of the financial year |
|
1,302.9 |
961.4 |
| Net profit attributable to members of BlueScope Steel Limited |
|
1,007.0 |
584.1 |
| Share buyback |
|
(122.9) |
- |
| Dividends paid |
|
(343.0) |
(241.6) |
| Aggregate of amounts transferred from reserves |
|
(3.0) |
(1.0) |
|
|
|
|
| |
|
1,841.0 |
1,302.9 |
|
|
|
|
note 9
full financial report
Further financial information can be obtained from the full financial report which is available from the company, free of charge, on request. A copy may be requested by contacting the company's share registrar whose details appear in the Corporate Directory. Alternatively, both the full financial report and the concise financial report can be accessed via the internet at .
|
| |
The directors declare that in their opinion, the concise financial report of the consolidated entity for the year ended 30 June 2005 as set out on pages 62 to 76 complies with Accounting Standard AASB 1029: Concise Financial Reports.
The financial statements and specific disclosures included in this concise financial report have been derived from the full financial report for the year ended 30 June 2005.
The concise financial report cannot be expected to provide as full an understanding of the financial performance, financial position and financing and investing activities of the consolidated entity as the full financial report, which as indicated in , is available on request.
This declaration is made in accordance with a resolution of the directors.
G J KRAEHE
CHAIRMAN
K C ADAMS
MANAGING DIRECTOR AND CEO
Melbourne
22 August 2005
|
| |
SCOPE
The concise financial report and directors' responsibility
The concise financial report comprises the statement of financial position, statement of financial performance, statement of cash flows and accompanying notes to the financial statements for the consolidated entity for the year ended 30 June 2005. The consolidated entity comprises both BlueScope Steel Limited (the company) and the entities it controlled during the year.
The directors of the company are responsible for preparing a concise financial report and the additional disclosures included in the directors' report are designated as audited ('the additional disclosures')":
� ,
� ; and
� ,
that complies with the Accounting Standard AASB 1039 "Concise Financial Reports", in accordance with the Corporations Act 2001. This includes responsibility for the maintenance of adequate accounting records and internal controls that are designed to prevent and detect fraud and error, and for the accounting policies and accounting estimates inherent in the concise financial report and the additional disclosures.
Audit approach
We conducted an independent audit on the concise financial report and the additional disclosures in order to express an opinion on them to the members of the company. Our audit was conducted in accordance with Australian Auditing Standards in order to provide reasonable assurance as to whether the concise financial report is free of material misstatement. The nature of an audit is influenced by factors such as the use of professional judgment, selective testing, the inherent limitations of internal control, and the availability of persuasive rather than conclusive evidence. Therefore, an audit cannot guarantee that all material misstatements have been detected.
We performed procedures to assess whether in all material respects the concise financial report and the additional disclosures are presented fairly in accordance with Accounting Standard AASB 1039 "Concise Financial Reports". We formed our audit opinion on the basis of these procedures, which included:
� testing that the information in the concise financial report and the additional disclosures are consistent with the full financial report, and
� examining, on a test basis, information to provide evidence supporting the amounts, discussion and analysis, and other disclosures in the concise financial report that were not directly derived from the full financial report.
We have also performed an independent audit of the full financial report of the company for the year ended 30 June 2005. Our audit report on the full financial report was signed on 22 August 2005, and was not subject to any qualification. For a better understanding of our approach to the audit of the full financial report, this report should be read in conjunction with our audit report on the full financial report.
INDEPENDENCE
We are independent of the company, and have met the independence requirements of Australian professional ethical pronouncements and the Corporations Act 2001. We have given to the directors of the company a written Auditors' Independence Declaration, signed on 22 August 2005, a copy of which is included in the Directors Report. In addition to our audit of the full and concise financial reports and the additional disclosures, we were engaged to undertake the services disclosed in the notes to the financial statements of the full financial report. The provision of these services has not impaired our independence.
AUDIT OPINION
In our opinion, the concise financial report and additional disclosures included in the Directors' Report designated as audited of BlueScope Steel Limited complies with Accounting Standard AASB 1039 "Concise Financial Reports".
ERNST & YOUNG
A I BECKETT
PARTNER
Melbourne
22 August 2005
|
| |
DISTRIBUTION SCHEDULE
| RANGE |
NO. OF HOLDERS |
NO. OF SHARES |
% OF ISSUED CAPITAL |
|
|
|
|
| 1- 1,000 |
119,445 |
50,678,632 |
7.16 |
| 1,001 - 5,000 |
57,520 |
128,249,766 |
18.11 |
| 5,001 - 10,000 |
7,329 |
52,364,061 |
7.39 |
| 10,001 - 100,000 |
3,625 |
74,824,531 |
10.57 |
| 100,001 and Over |
243 |
402,033,020 |
56.77 |
|
|
|
|
| Total |
188,162 |
708,150,010 |
100.00 |
|
|
|
|
The number of security investors holding less than a marketable parcel of 54 securities ($9.320 on 31/08/2005) is 4,116 and they hold 122,378 securities.
TWENTY LARGEST REGISTERED SHAREHOLDERS AS WEDNESDAY 31 AUGUST 2005
| RANK |
NAME OF SHAREHOLDER |
TOTAL UNITS |
% OF ISSUED CAPITAL |
|
|
|
|
| 1 |
J P MORGAN NOMINEES AUSTRALIA LIMITED |
86,811,322 |
12.26% |
| 2 |
WESTPAC CUSTODIAN NOMINEES LIMITED |
83,205,333 |
11.75% |
| 3 |
NATIONAL NOMINEES LIMITED |
68,608,018 |
9.69% |
| 4 |
ANZ NOMINEES LIMITED |
21,359,637 |
3.02% |
| 5 |
CITICORP NOMINEES PTY LIMITED |
17,997,509 |
2.54% |
| 6 |
RBC GLOBAL SERVICES AUSTRALIA NOMINEES PTY LIMITED |
11,731,680 |
1.66% |
| 7 |
QUEENSLAND INVESTMENT CORPORATION |
10,017,490 |
1.41% |
| 8 |
COGENT NOMINEES PTY LIMITED |
9,754,455 |
1.38% |
| 9 |
AMP LIFE LIMITED |
4,836,089 |
0.68% |
| 10 |
HSBC CUSTODY NOMINEES (AUSTRALIA) LIMITED |
4,614,603 |
0.65% |
| 11 |
WESTPAC FINANCIAL SERVICES LIMITED |
4,588,242 |
0.65% |
| 12 |
SUNCORP CUSTODIAN SERVICES PTY LIMITED |
3,573,181 |
0.50% |
| 13 |
IAG NOMINEES PTY LIMITED |
3,261,590 |
0.46% |
| 14 |
UBS NOMINEES PTY LTD |
2,813,300 |
0.40% |
| 15 |
PSS BOARD |
2,304,825 |
0.33% |
| 16 |
GOVERNMENT SUPERANNUATION OFFICE |
2,215,307 |
0.31% |
| 17 |
CITICORP NOMINEES PTY LIMITED |
1,838,293 |
0.26% |
| 18 |
VICTORIAN WORKCOVER AUTHORITY |
1,676,833 |
0.24% |
| 19 |
CSS BOARD |
1,676,833 |
0.24% |
| 20 |
HEALTH SUPER PTY LTD |
1,600,454 |
0.23% |
|
|
|
|
| |
Total for Top 20 |
344,486,710 |
48.65% |
| |
Total other investors |
363,663,300 |
51.35% |
|
|
|
|
| |
Grand total |
708,150,010 |
100.00% |
|
|
|
|
The on-market buyback ended on Friday 2 September 2005.
Substantial Shareholders
Barclays Global Investors Australia Limited, by a notice of initial substantial holder dated 10 March 2003, advised that it and its associates were entitled to 39,730,425 ordinary shares.
AXA and AXA Asia Pacific Holdings Limited, by a notice of change in interests of a substantial holder dated 25 August 2005, advised that it and its associates were entitled to 46,760,523 ordinary shares.
|
|
|
|
| |
|
| | | | | | | | |